Submit your review | |
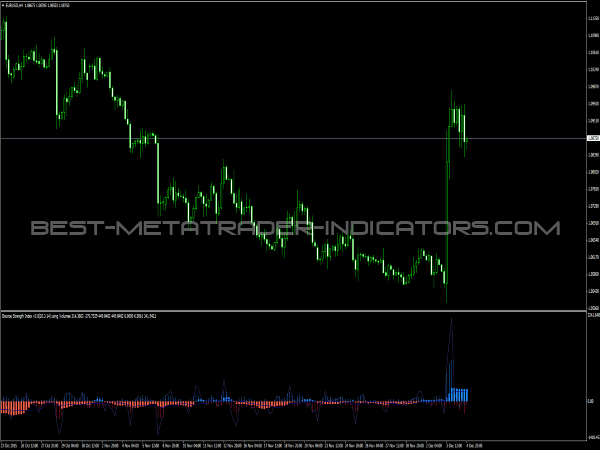
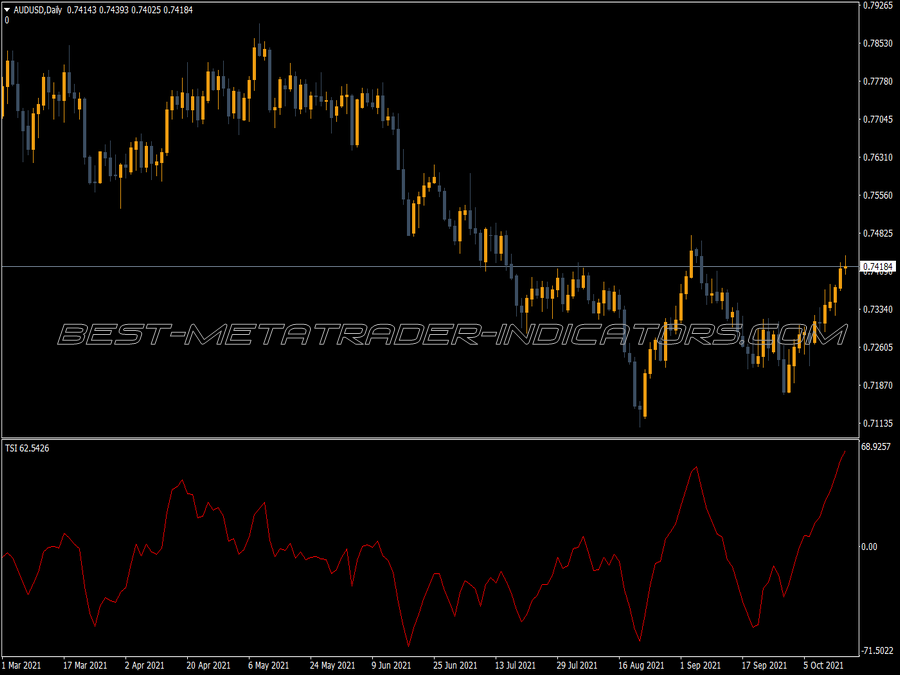
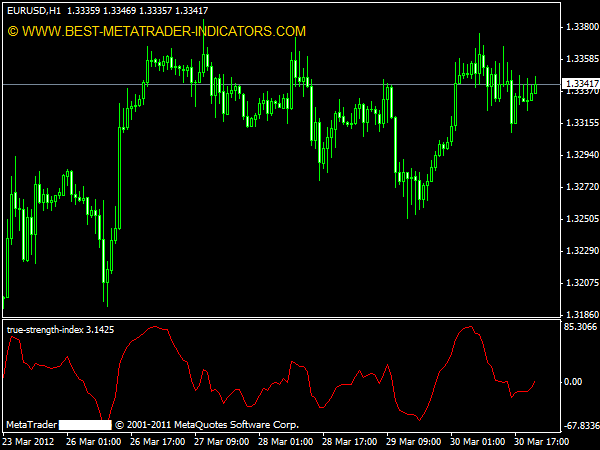
The basic idea of the TSI is trying to create an oscillator that is synchronous (while the momentum often has a leading, and most other indicators have a trailing). The developer Wilhelm Blau took a 1-day momentum, which he subjected to various smoothing by EMAs.
However, the formula can be modified as desired, depending on the course behavior. A 7-bar EMA of the indicator was used as the signal line. The histogram also gives good signals. Nevertheless, the original idea is not so interesting, because this indicator is also susceptible to sudden changes in direction. However, he gives a favorable trend following signal, which was first described by Bill Williams.
A buy signal occurs here when the TSI falls above zero and then forms a bottom without crossing the zero line. A sell signal is formed when it forms a peak below the zero line and falls again. These signals often catch well the corrections against the trend.
They are very well suited, also for timing in the intraday range, also for day trading. However, due to the speed of the indicator, there are more often false signals, so you should connect the indicator with important resistance and support lines, such as Fibonacci, Murrey or planetary lines or the modern indicators.
Seems to be a repainter.
Unknown but great.
I have tested for a short while. It is very smoothed and fairly accurate!
Awesome indicator in predicting strengh trend
this is the best.
Simply awesome accuracy in trading
