Submit your review | |
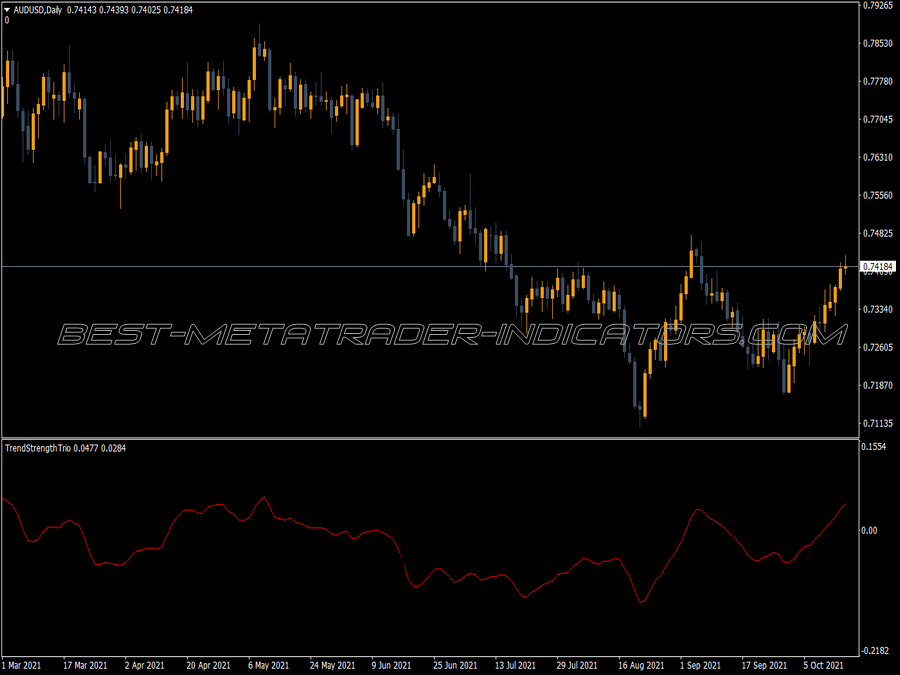
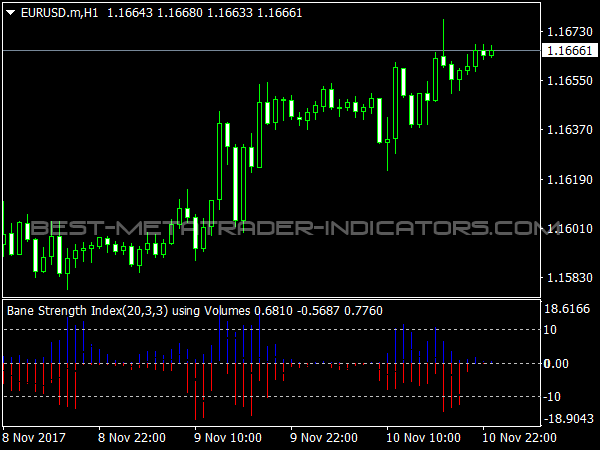
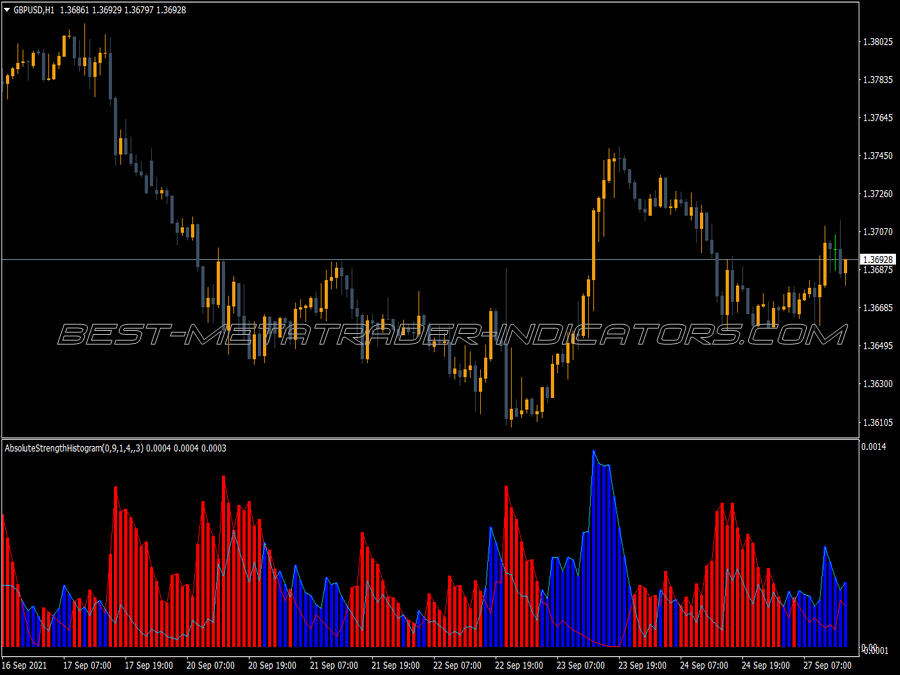
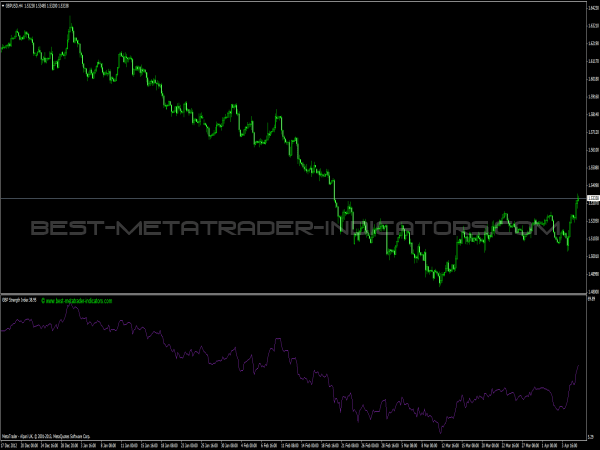
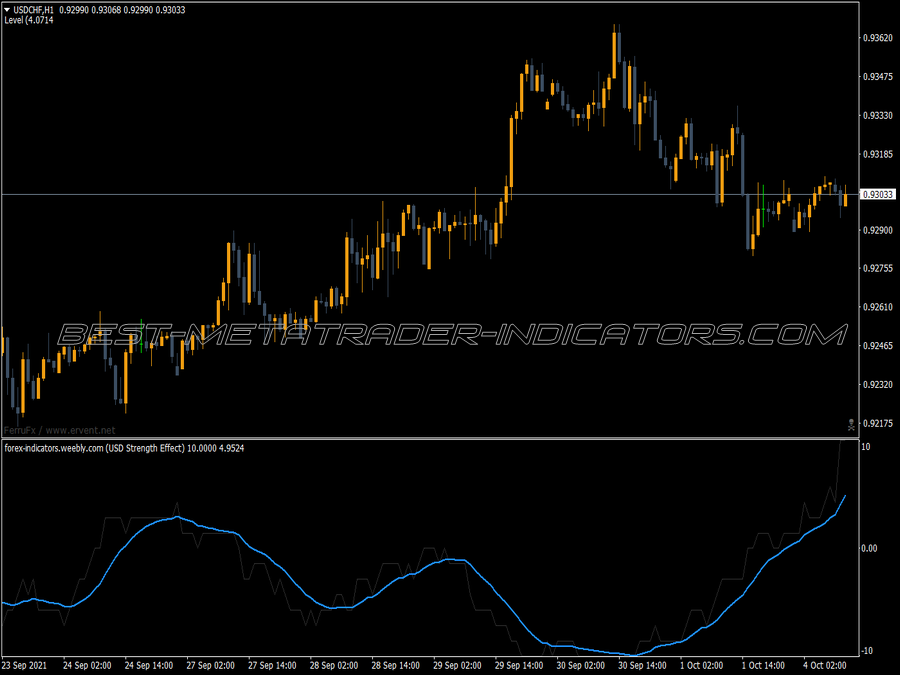
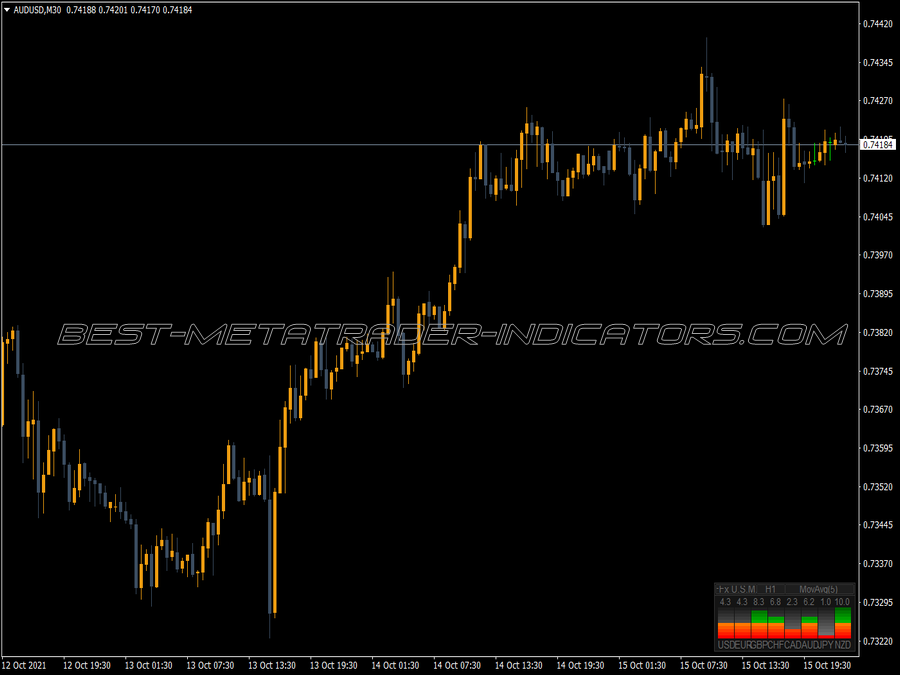
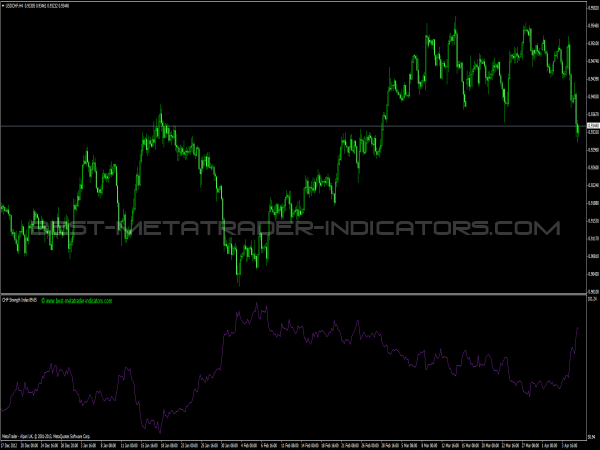
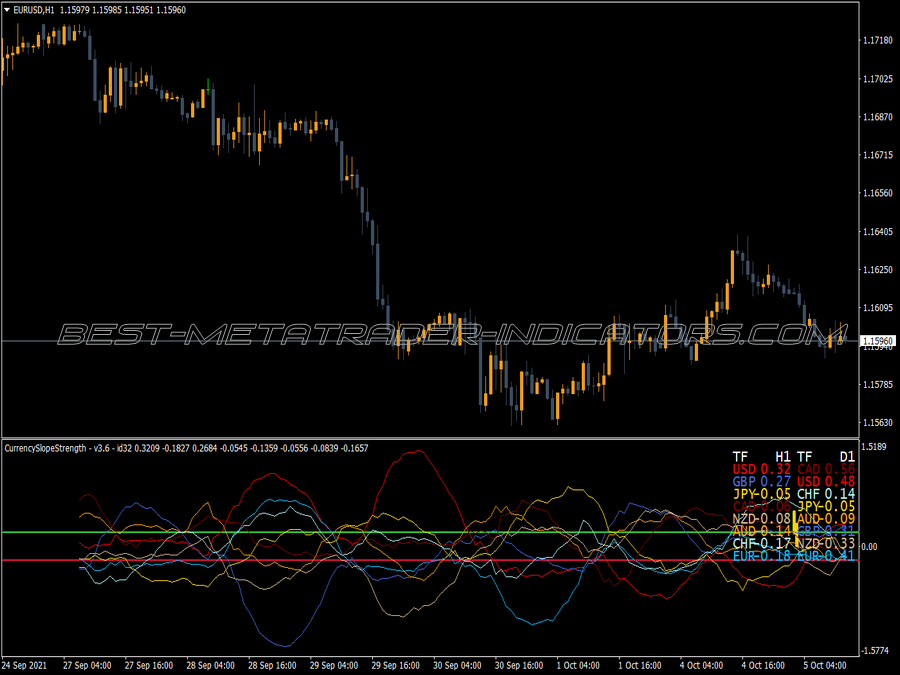
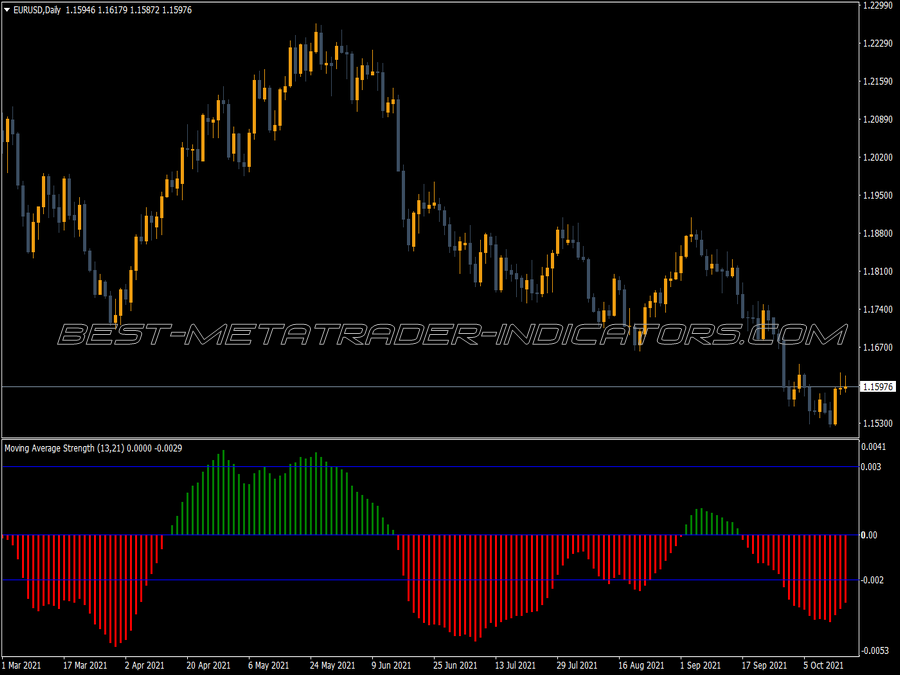
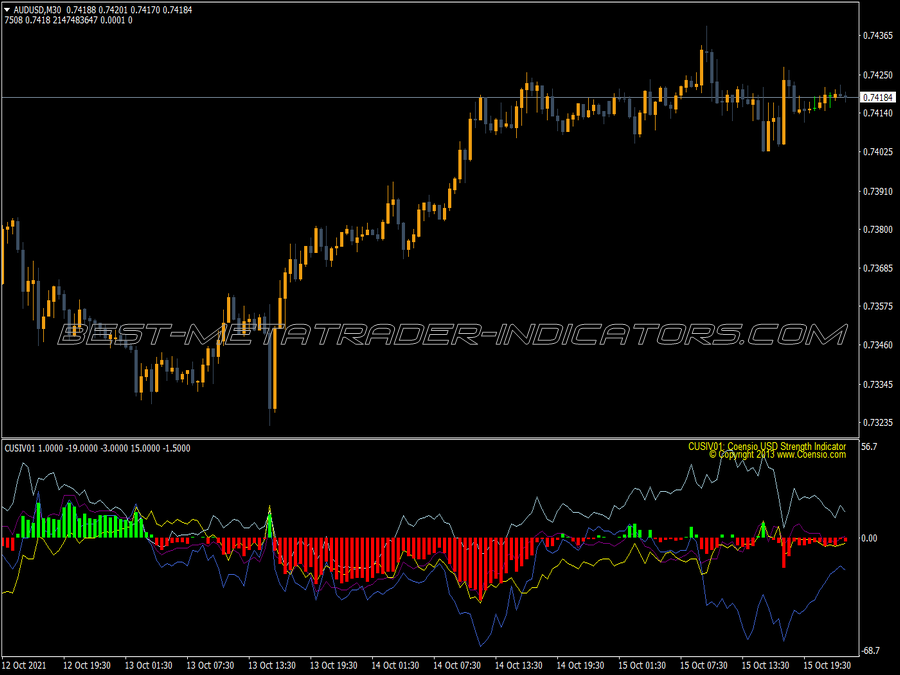
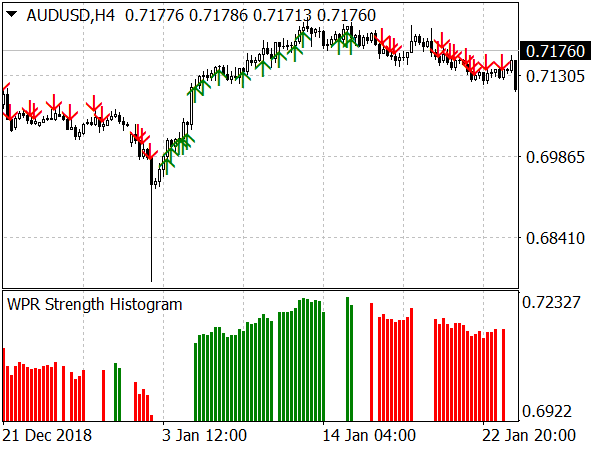
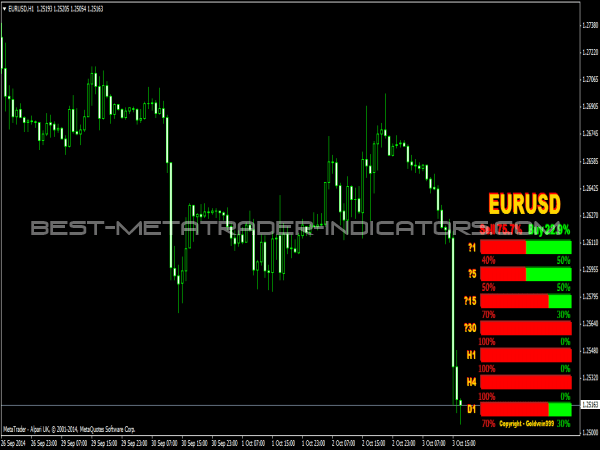
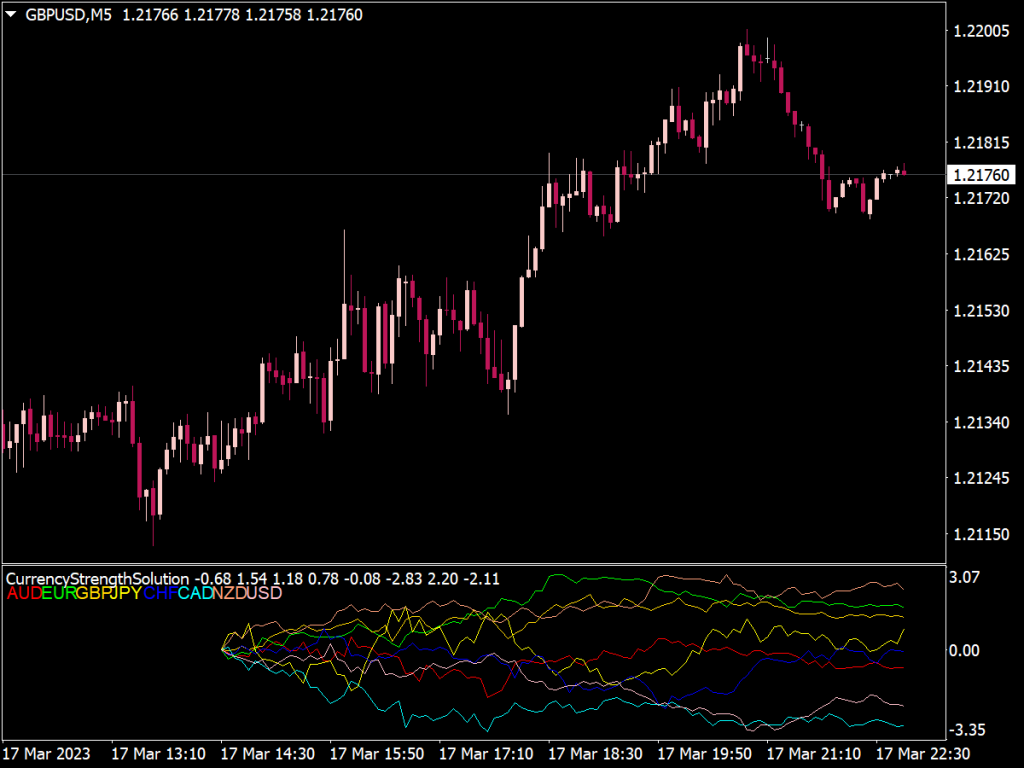
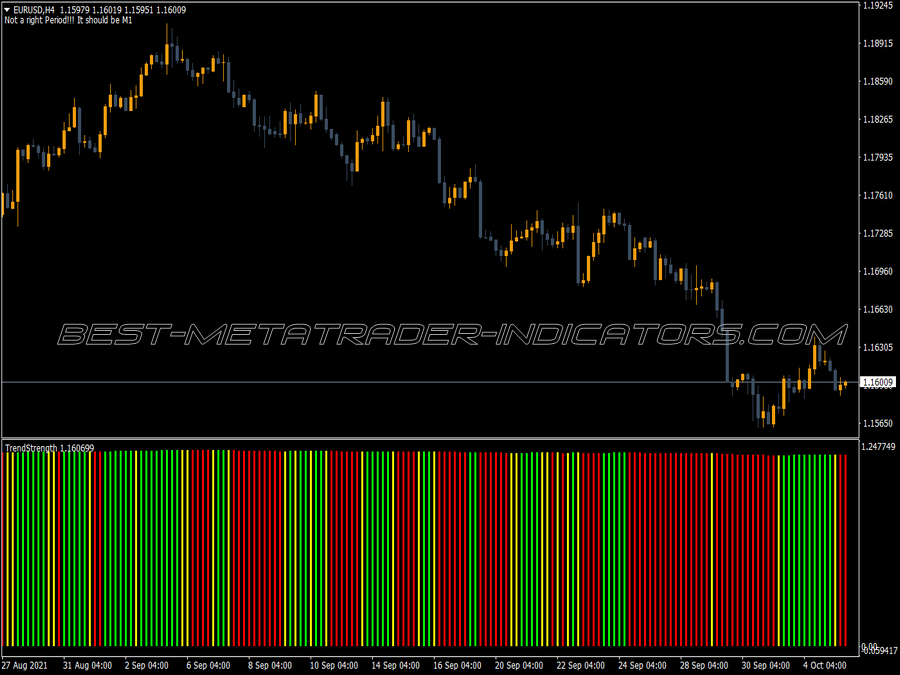
The Trend Strength Indicator (TSI) is a technical analysis tool used to quantify the strength of a market trend, helping traders identify potential entry and exit points. It typically combines moving averages and price momentum to assess whether a trend is gaining or losing strength.
A higher TSI value indicates a stronger upward trend, while a lower or negative value suggests a downward trend. Traders often use the TSI in conjunction with other indicators to confirm signals and improve decision-making in various market conditions.
Key Components of Trend Strength Trading Strategies
1. Identifying the Trend:
Before implementing any strategy, it is necessary to identify the current market trend. Various indicators can assist in this:
• Moving Averages: Simple Moving Averages (SMA) or Exponential Moving Averages (EMA) can help determine the overall direction of the market. A bullish trend is identified when prices are above the moving average, while a bearish trend is identified when prices are below it.
• Trend Lines: Drawing trend lines can visually indicate the trend's direction. An upward trend line is formed by connecting the higher lows, while a downward trend line connects the lower highs.
2. Using the Trend Strength Indicator (TSI):
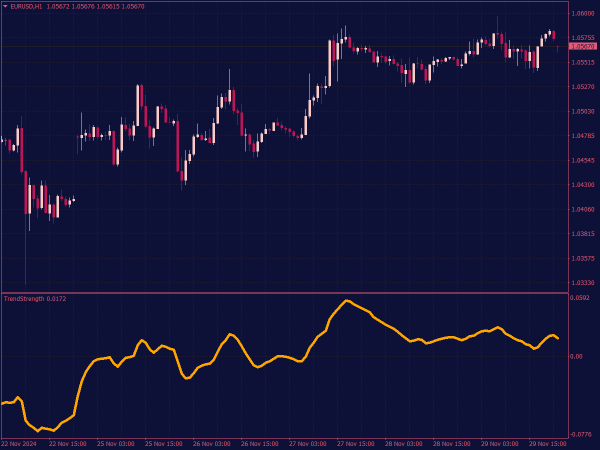
The TSI is calculated based on the price changes over specified periods and can be used to gauge the strength of the current trend. The TSI values range from -1 to +1, where values above 0 indicate a bullish trend and values below 0 indicate a bearish trend.
• Entry Signal: A common entry signal occurs when the TSI crosses above the zero line in a bullish trend or below it in a bearish trend.
• Exit Signal: Conversely, traders may exit positions when the TSI begins to flatten or crosses back over the zero line.
3. Incorporating Additional Indicators:
To increase the robustness of your trading strategy, you can incorporate other indicators alongside TSI:
• Relative Strength Index (RSI): This momentum oscillator indicates whether an asset is overbought or oversold. An RSI above 70 often signals an overbought condition, while below 30 indicates oversold, potentially acting as a warning to exit or reduce exposure.
• Average True Range (ATR): The ATR measures market volatility. Higher ATR values suggest that a strong trend may continue, while lower values may indicate possible trend reversals.
TSI & Moving Averages Crossover Trading Strategy
1. Set Your Time Frame: 1-hour or daily charts work well.
2. Indicators Used: 20-period EMA for trend direction and TSI for strength.
3. Entry Signal:
• Go long when the price crosses above the 20 EMA, and the TSI crosses above the zero line.
• Go short when the price crosses below the 20 EMA, and the TSI crosses below the zero line.
4. Exit Signal:
• Use the TSI to exit; if it crosses back below zero for long positions or above for shorts, close the trade.
Strategy with TSI, RSI & Support/Resistance Levels
1. Identify Levels: Use historical price data to identify key support and resistance levels.
2. Indicators Used: TSI and RSI.
3. Entry Signal:
• Place a buy order if the price approaches a support level, the RSI is below 30, and the TSI crosses above zero.
• Place a sell order if the price nears a resistance level, the RSI is above 70, and the TSI crosses below zero.
4. Exit Signal:
• Exit trades at the next support or resistance level or if the TSI indicates a reversal.
Trend Continuation Strategy with TSI & ATR
1. Check Volatility: Use ATR to assess the strength and sustainability of the trend.
2. Indicators Used: TSI and ATR.
3. Entry Signal:
• In a strong trend indicated by the TSI, enter trades when the ATR shows a significant increase in volatility.
• Buy if TSI is above zero and ATR shows increasing volatility; sell if TSI is below zero.
4. Exit Signal: Consider exiting if the ATR begins to decrease, suggesting weakening momentum.
Risk Management Strategies
Regardless of the strategy employed, effective risk management is crucial:
• Position Sizing: Avoid risking more than 1-2% of your trading capital on a single trade.
• Stop-Loss Orders: Set tight stop-loss orders to limit potential losses, ideally below the support level for long trades and above the resistance level for short trades.
• Regular Review: Periodically review and adjust your strategy based on market performance and changing conditions.
Conclusion
Trend strength trading strategies provide traders with the essential tools to exploit established market movements. By effectively using indicators such as the TSI in conjunction with other complementary tools like RSI and ATR, traders can identify optimal entry and exit points while implementing risk management practices.
As with any trading approach, continuous practice and adaptation to market changes will improve overall success and profitability in trading endeavors.
