Submit your review | |
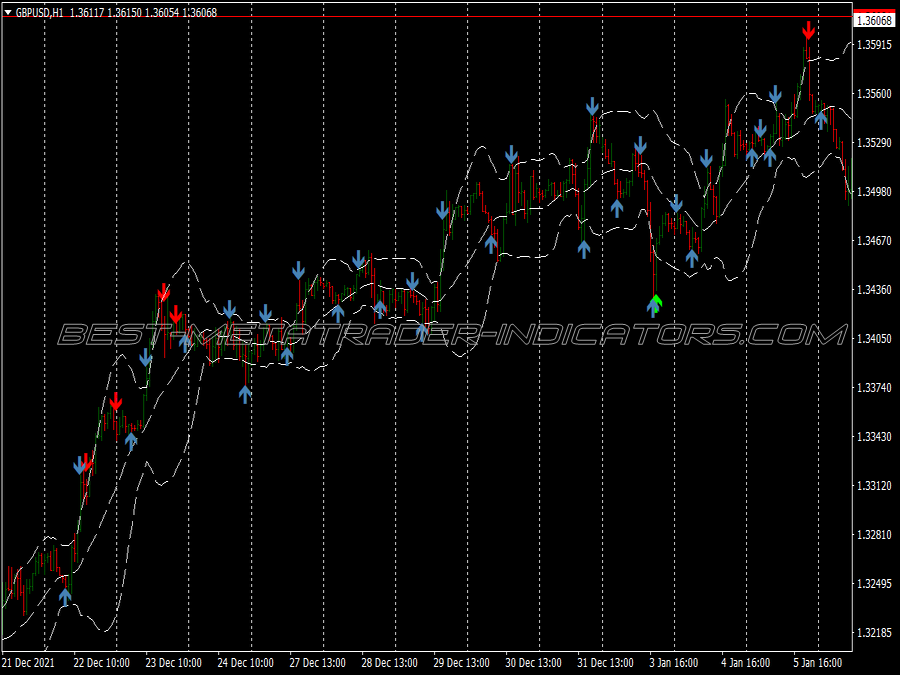
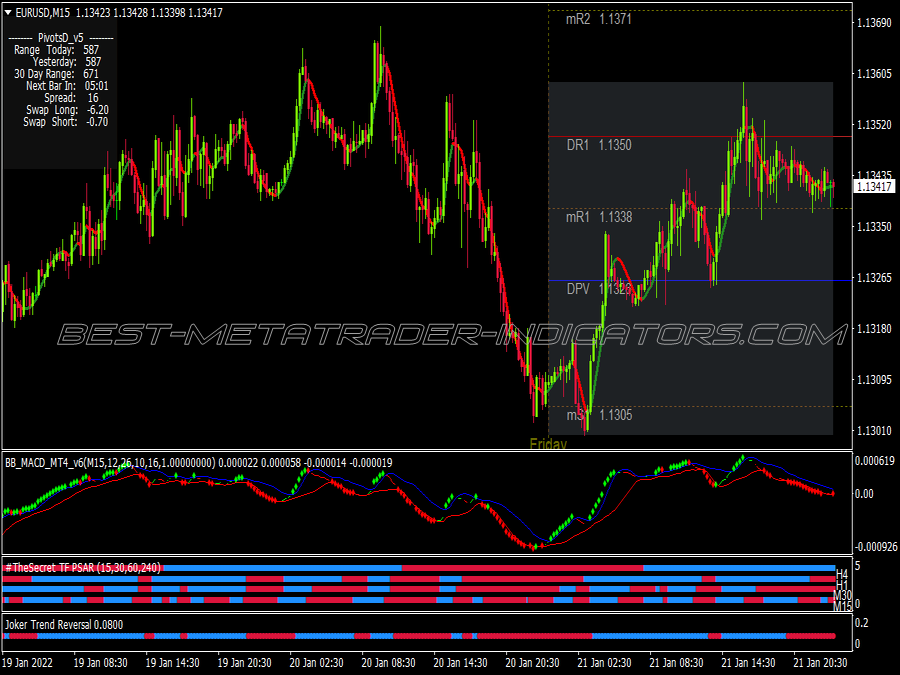
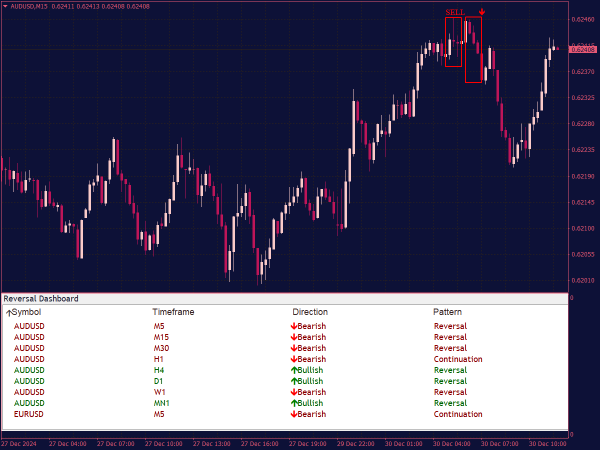
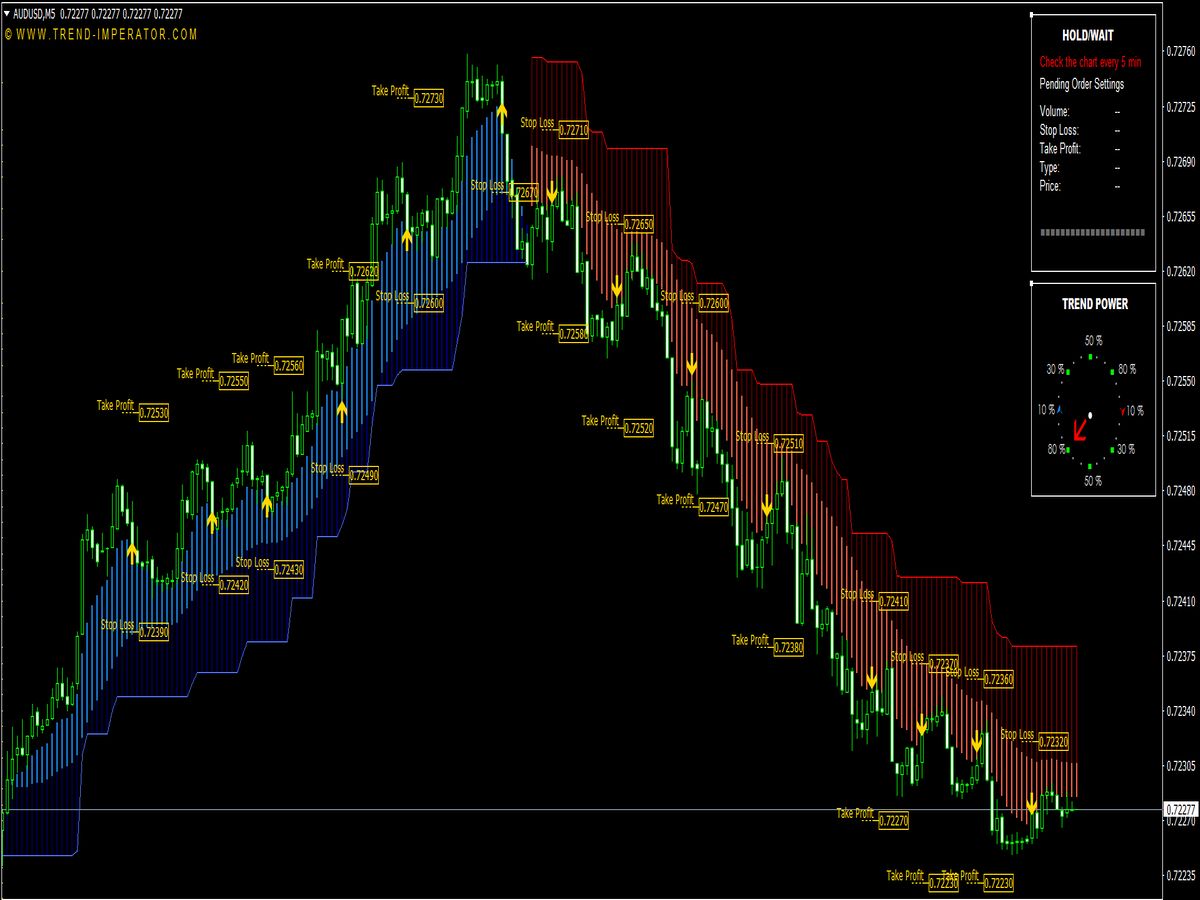
Trend reversal trading is a strategy that aims to identify points at which the current trend (upward or downward) is likely to change direction. Traders use various technical analysis tools, such as trendlines, moving averages, and various indicators (like the Relative Strength Index or MACD), to spot potential reversal signals.
Common patterns indicating reversals include head and shoulders, double tops/bottoms, and candlestick formations like hammers or engulfing patterns. Successful trend reversal trading requires careful risk management and confirmation of signals through multiple indicators to enhance the likelihood of a profitable trade.
1. Understanding Market Sentiment
Market sentiment plays a crucial role in predicting trend reversals. Before implementing a specific strategy, traders often gauge market sentiment through tools such as sentiment indicators, news analysis, and social media trends. High levels of optimism may lead to overbought conditions, while excessive pessimism may indicate oversold conditions.
Sentiment Indicators: Tools like the Fear and Greed Index can provide valuable insights. For example, a high fear level might suggest an impending market reversal from a downtrend, while extreme greed could signal a potential downturn from an uptrend.
2. Candlestick Patterns
Candlestick patterns are powerful visual tools for identifying potential trend reversals. Specific formations can indicate market indecision or a shift in momentum.
• Hammer and Hanging Man: A hammer appears during a downtrend and signals potential reversal to the upside, while a hanging man appears during an uptrend, suggesting a possible downturn.
• Engulfing Patterns: A bullish engulfing pattern occurs when a small red candle is followed by a large green candle, potentially signaling a reversal to the upside. Conversely, a bearish engulfing pattern is formed when a small green candle is followed by a large red candle, indicating a possible downturn.
These patterns work best in conjunction with other indicators to confirm the likelihood of a reversal.
3. Using Moving Averages
Moving averages (MAs) smooth out price action and help traders identify trends. A common strategy for trend reversal involves observing moving average crossovers.
Crossovers: A bullish reversal signal may occur when a short-term moving average crosses above a longer-term moving average (e.g., the 50-day crossing above the 200-day MA). Conversely, a bearish reversal is indicated when a short-term MA crosses below a long-term MA.
Golden and Death Crosses: A "Golden Cross" occurs when a short-term MA crosses above a long-term MA, often positioned as a bullish signal, whereas a "Death Cross" marks a downward reversal when the short-term MA crosses below the long-term MA.
4. Fibonacci Retracement Levels
Fibonacci retracement levels are widely used to identify potential reversal zones in the market. Traders look for retracements to key Fibonacci levels (23.6%, 38.2%, 50%, 61.8%, and 76.4%) after a substantial price movement.
Application: After a strong upward move, traders watch for price action to reverse near the 38.2% or 61.8% Fibonacci levels. If the price stalls and reverses at these levels, it can provide a buying opportunity, indicating a continuation of the overall trend.
5. Relative Strength Index (RSI)
The RSI is a momentum oscillator that measures the speed and change of price movements. It helps identify overbought or oversold conditions, indicating potential trend reversals.
Strategy: When the RSI is above 70, the market is generally considered overbought, suggesting a potential bearish reversal. Conversely, an RSI below 30 indicates oversold conditions, hinting at a bullish reversal. Traders often look for divergence between the RSI and price action, reinforcing reversal signals.
6. Moving Average Convergence Divergence (MACD)
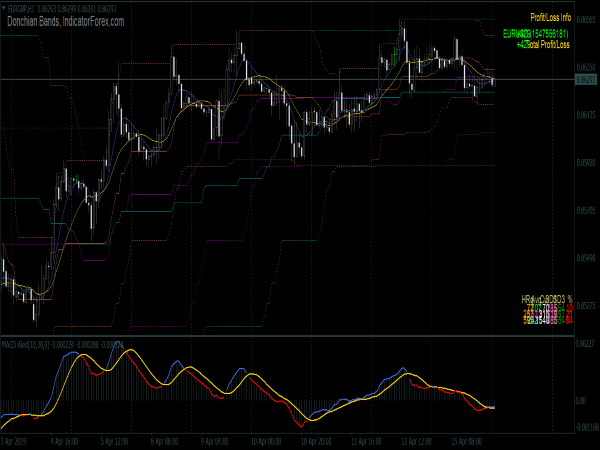
The MACD is another invaluable indicator for identifying trend reversals. It consists of two moving averages and a histogram that represents the difference between these averages.
Crossovers: Bullish and bearish crossovers of the MACD line (the difference between the 12-day and 26-day EMAs) and the signal line (a 9-day EMA of the MACD line) can indicate potential trend reversals. A bullish crossover suggests a possible upward reversal, while a bearish crossover hints at a downward reversal.
Divergence: Divergence between the MACD and price action can also signal potential reversals. For instance, if the price is making new highs while the MACD is making lower highs, this divergence can indicate a weakening trend and potential reversal.
7. Volume Analysis
Volume analysis often provides insights into the strength of a trend and potential reversals. A rise in volume during price reversals can confirm the validity of the move.
Volume Patterns: Higher volumes during bullish or bearish reversals suggest that the trend change has strength. Conversely, low volume during a reversal may indicate a lack of conviction, making the reversal less reliable.
In practical situations, traders may wait for confirmation of a reversal by observing subsequent price action and volume before entering a trade.
8. Combining Multiple Indicators
Using a combination of indicators strengthens the likelihood of successful trend reversal predictions. For example, if a bullish engulfing pattern emerges at a Fibonacci retracement level, confirmed by an RSI below 30 and higher volume, this multi-faceted approach provides a more reliable entry point.
9. Risk Management Techniques
Every trading strategy comes with an inherent risk. Proper risk management techniques are essential to mitigate potential losses when employing trend reversal strategies.
Stop-Loss Orders: Placing stop-loss orders just below recent swing lows (for long trades) or above recent swing highs (for short trades) helps protect against significant losses.
Position Sizing: Determining an appropriate position size based on the risk tolerance level helps in managing exposure and maintaining capital.
Take-Profit Targets: Setting take-profit orders based on risk-reward ratios (such as 1:2 or 1:3) provides clarity on when to exit trades profitably.
Conclusion
Trend reversal strategies offer traders opportunities to profit from significant shifts in market direction. By understanding market sentiment, utilizing technical indicators, employing sound risk management practices, and combining various analytical tools, traders can increase their chances of successfully identifying trend reversals. However, it is crucial to remember that no strategy is foolproof; maintaining discipline and adaptability to changing market conditions is vital for long-term success.
