Submit your review | |
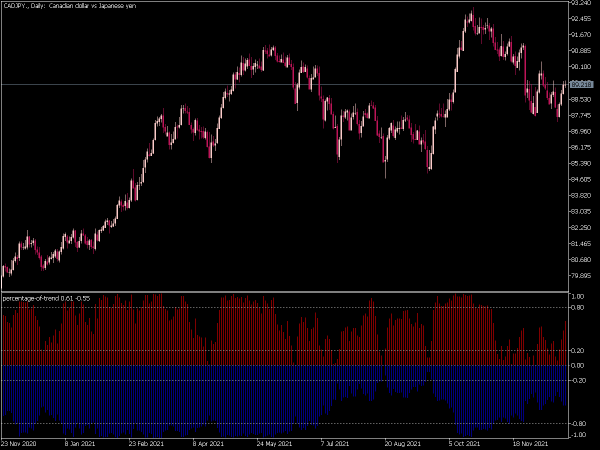
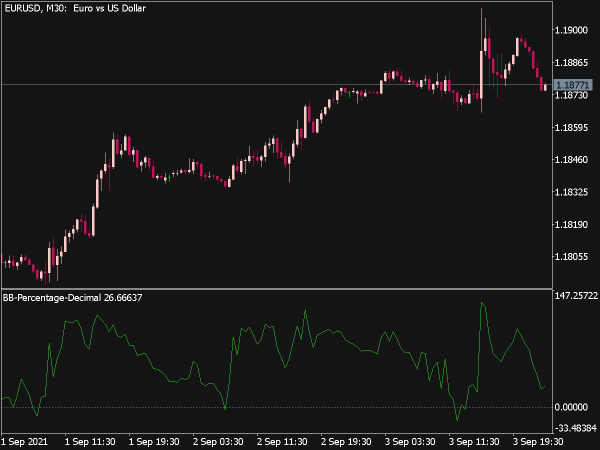
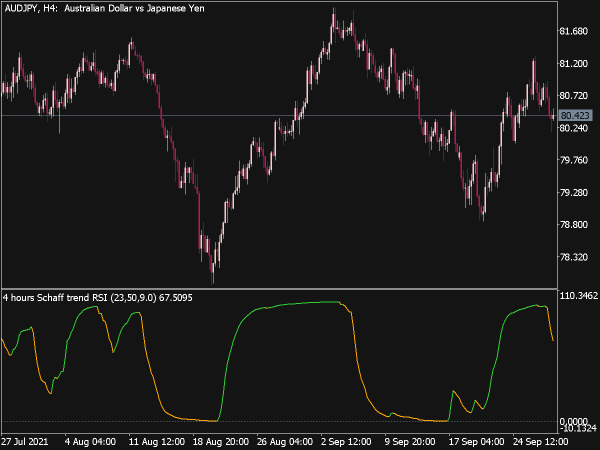
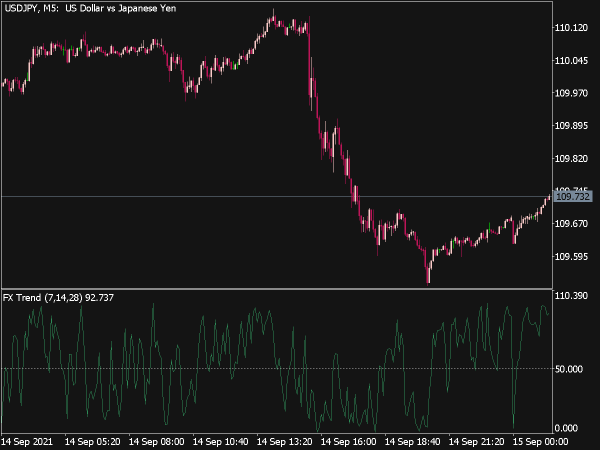
The indicator expresses the 10-day GD of closing prices as a percentage of the daily trading range. For example, if it was 10 points in one day, and the closing price was exactly in the middle, this would be 50%. 100% would mean that the closing price is at the high, 0% that it is at the low.
This indicator differentiates between trends and sideways movements. In a bull market, it will be in the upper extreme range without an overbought situation, if such a situation occurs, i.e. if prices start to fall soon after, the market is no longer in a bullish mood. Furthermore, he indicates strong movements. As for the S&P, values of more than 75% in the indicator indicate that the S&P will rise twice as much as the average within the next 22 trading days.
