Submit your review | |
ℹ️ How to Recognize Price Trend with a Trend Line
How are you, fellow analysts and traders? Now we’re going to touch more on price trend along with our previous discussion. Talking about price trend has always been in technical analysis world since centuries ago. It's no wonder as price trend is the first thing to recognize before identifying any other elements while doing a market analysis.
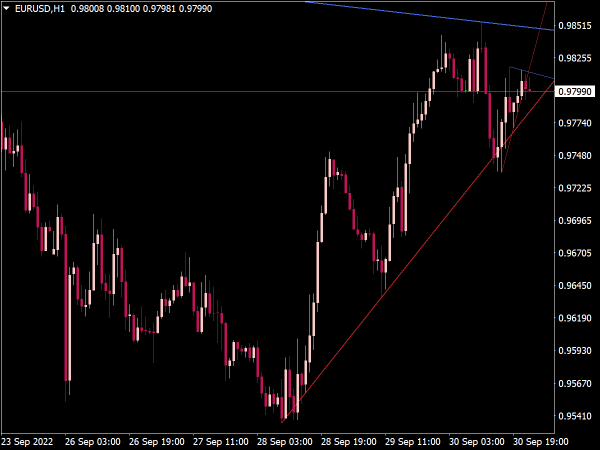
Let's pay attention on the following sentences about how to use a trend line in correct way. Trend line is indeed the simplest technical analysis tool to put on a chart, but when you draw it in a right way you will see how powerful a trend line is.
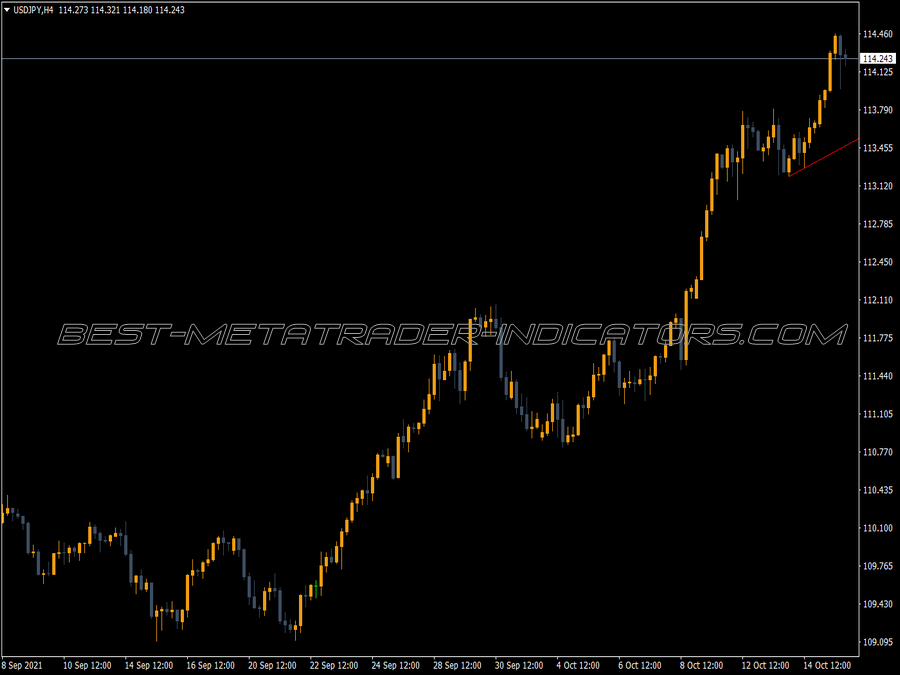
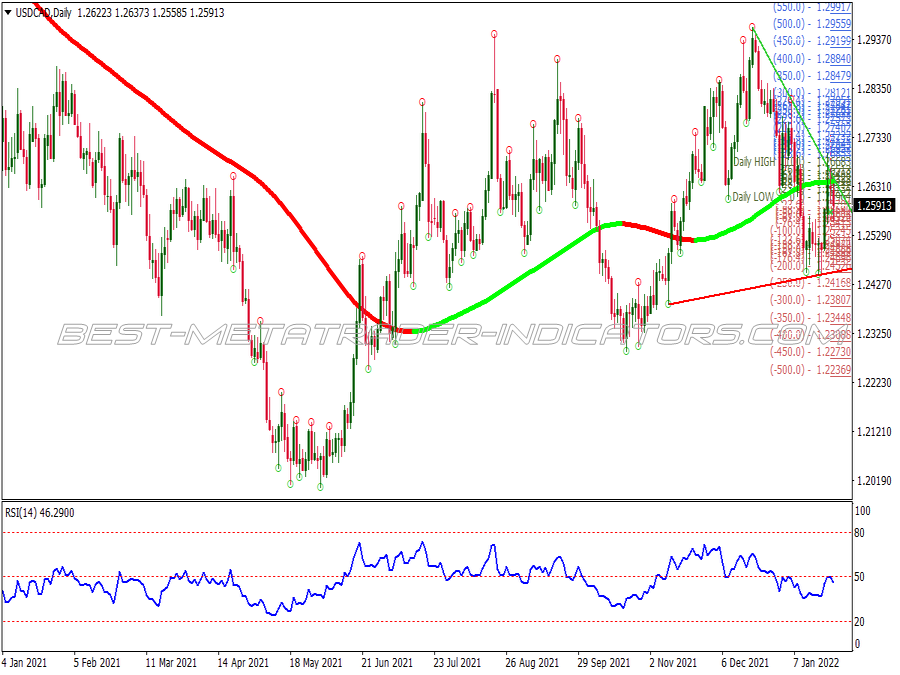
To draw a trend line is simply by connecting two tops or bottoms with a line. Remember that the most important thing here is finding significant tops or bottoms. Having failure to recognize such important levels will lead you to draw a wrong trend line and in trading world it can be costly. The trick is you have to be able to see the beginning of a trend, or the first point and the most significant top or bottoms of a correction.
The 1% rule means when price closes 1% below or above a trend line, price trend will likely to shift or in other words, price successfully breaks a trend line. And the two-day rule states that an analyst needs to see whether or not price continues moving away, or closing below or above, from a trend line in the second day after it penetrates a trend line in the first day.
If you still have troubles to draw a trend line correctly, it's ok. We made many mistakes while learning the correct way to draw a trend line as well. Just practice it and keep on visiting Best-MetaTrader-Indicators.com where we share our knowledge on technical analysis. Definitely it is helpful for you. See you again!
