Submit your review | |
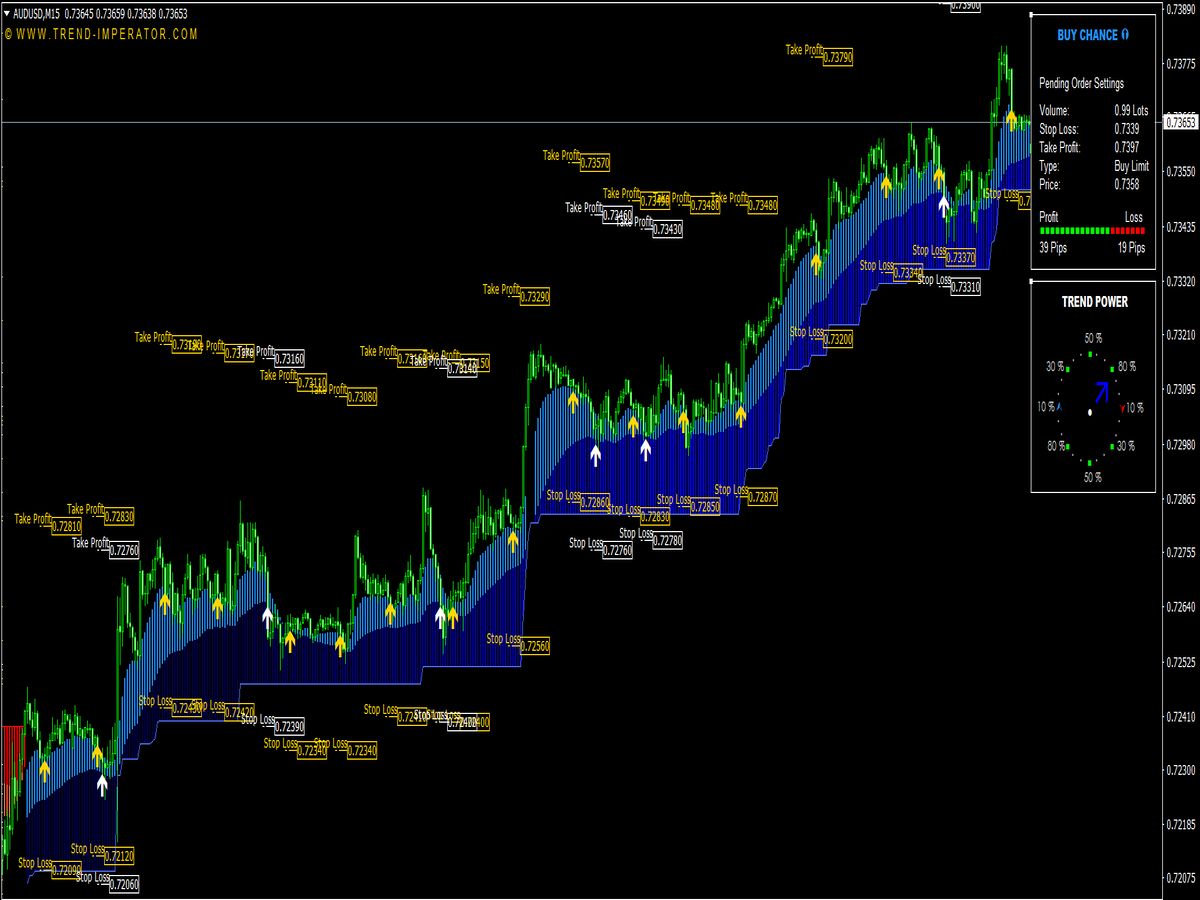
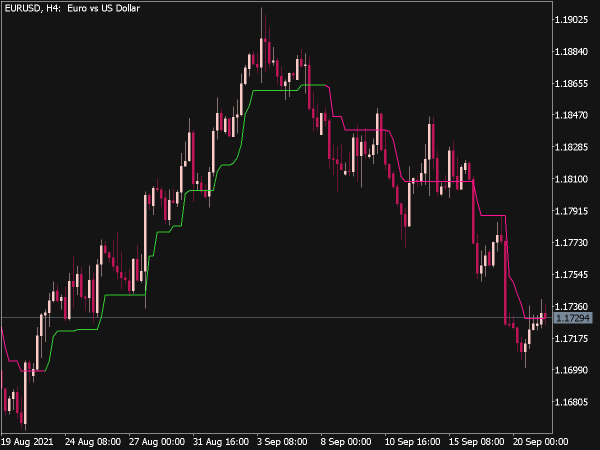
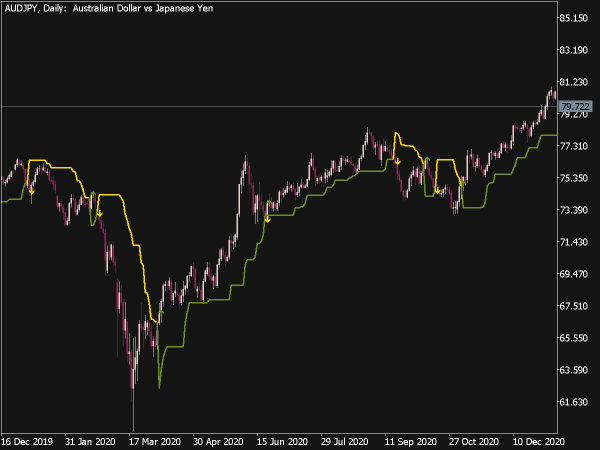
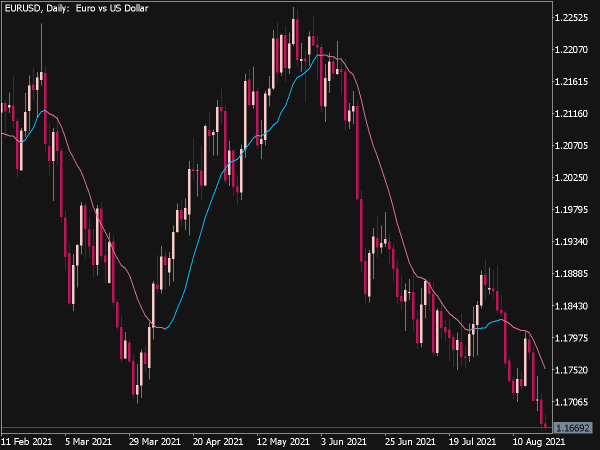
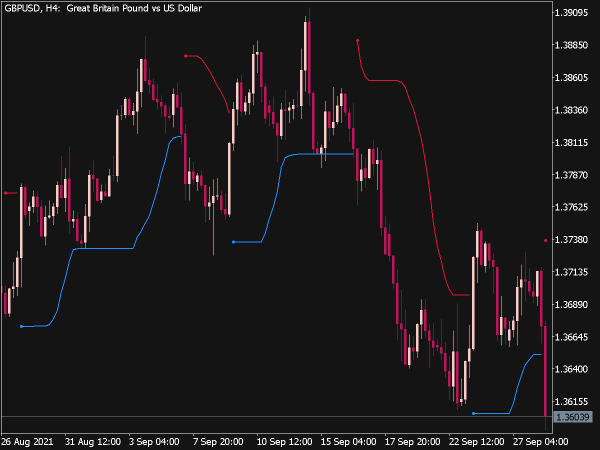
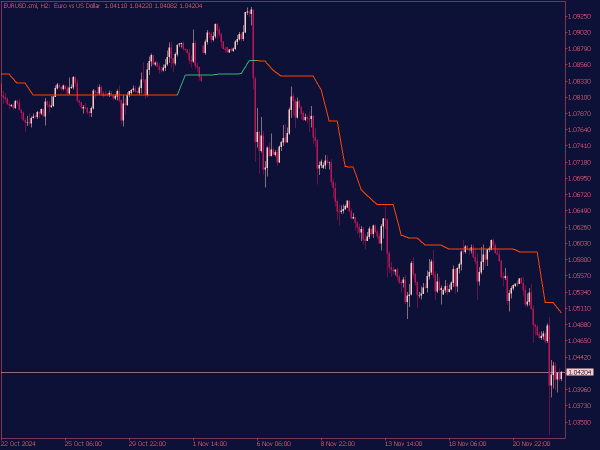
The SuperTrend Indicator is a technical analysis tool used to identify the direction of market trends and potential entry and exit points for trades. It is based on the concept of price volatility and typically consists of two lines: the upper line (which indicates a potential sell signal when prices cross below) and the lower line (indicating a potential buy signal when prices cross above).
The indicator is calculated using the Average True Range (ATR) to set its distance from the price, making it adaptive to market conditions. Traders often use the SuperTrend to confirm trend direction and avoid false signals, enhancing their trading strategies.
Here are several trading strategies that leverage the SuperTrend Indicator:
1. Basic Buy and Sell Signals
• Buy Signal: Enter a trade when the price crosses above the SuperTrend line, indicating a potential upward trend.
• Sell Signal: Enter a trade when the price crosses below the SuperTrend line, suggesting a potential downward trend.
2. Combining SuperTrend with Moving Averages
• Use the SuperTrend Indicator alongside a short-term moving average (e.g., 20-period SMA) and a long-term moving average (e.g., 50-period SMA).
• Buy when the price is above both moving averages and the SuperTrend indicates an upward trend. Sell when the price is below both moving averages and the SuperTrend indicates a downward trend.
3. SuperTrend with RSI Confirmation
• Combine the SuperTrend with the Relative Strength Index (RSI) to filter trades.
• Look for a buy signal from the SuperTrend when the RSI is below 30 (oversold condition). Conversely, a sell signal should occur when the SuperTrend indicates a downward trend and the RSI is above 70 (overbought condition).
4. Trend Following with Multiple Time Frames
• Use the SuperTrend Indicator across multiple time frames to confirm trends.
• Trade on a lower time frame (like 1-hour) in the direction indicated by the SuperTrend on a higher time frame (like daily). This helps to align trades with the overall market trend.
5. SuperTrend with Fibonacci Retracements
• Utilize Fibonacci levels to identify potential reversal points in conjunction with SuperTrend signals.
• Trade in the direction of the SuperTrend and only enter when the price retraces to a significant Fibonacci level (such as 38.2% or 61.8%) during an uptrend or downtrend.
6. SuperTrend and MACD Convergence
• Use the Moving Average Convergence Divergence (MACD) alongside the SuperTrend Indicator for entry confirmation.
• Buy when the SuperTrend gives a buy signal and the MACD line crosses above its signal line, indicating bullish momentum. Use the opposite for sell signals.
7. SuperTrend with Bollinger Bands
• Combine the SuperTrend with Bollinger Bands to measure volatility and momentum.
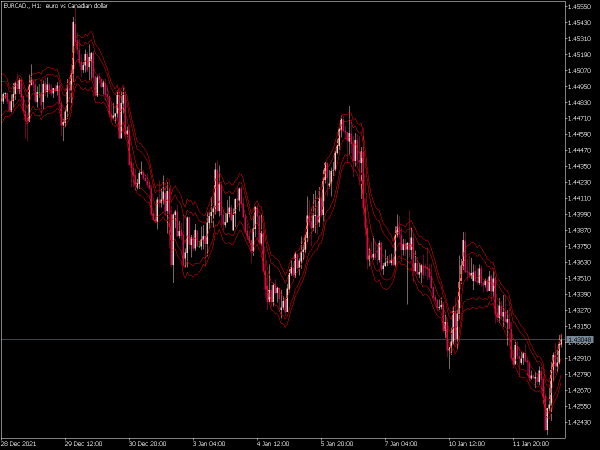
• Enter a buy order when the price breaks above the upper Bollinger Band and the SuperTrend is in a bullish phase. Conversely, sell when the price breaks below the lower Bollinger Band and the SuperTrend indicates a bearish trend.
8. Stop-Loss and Take-Profit Strategy
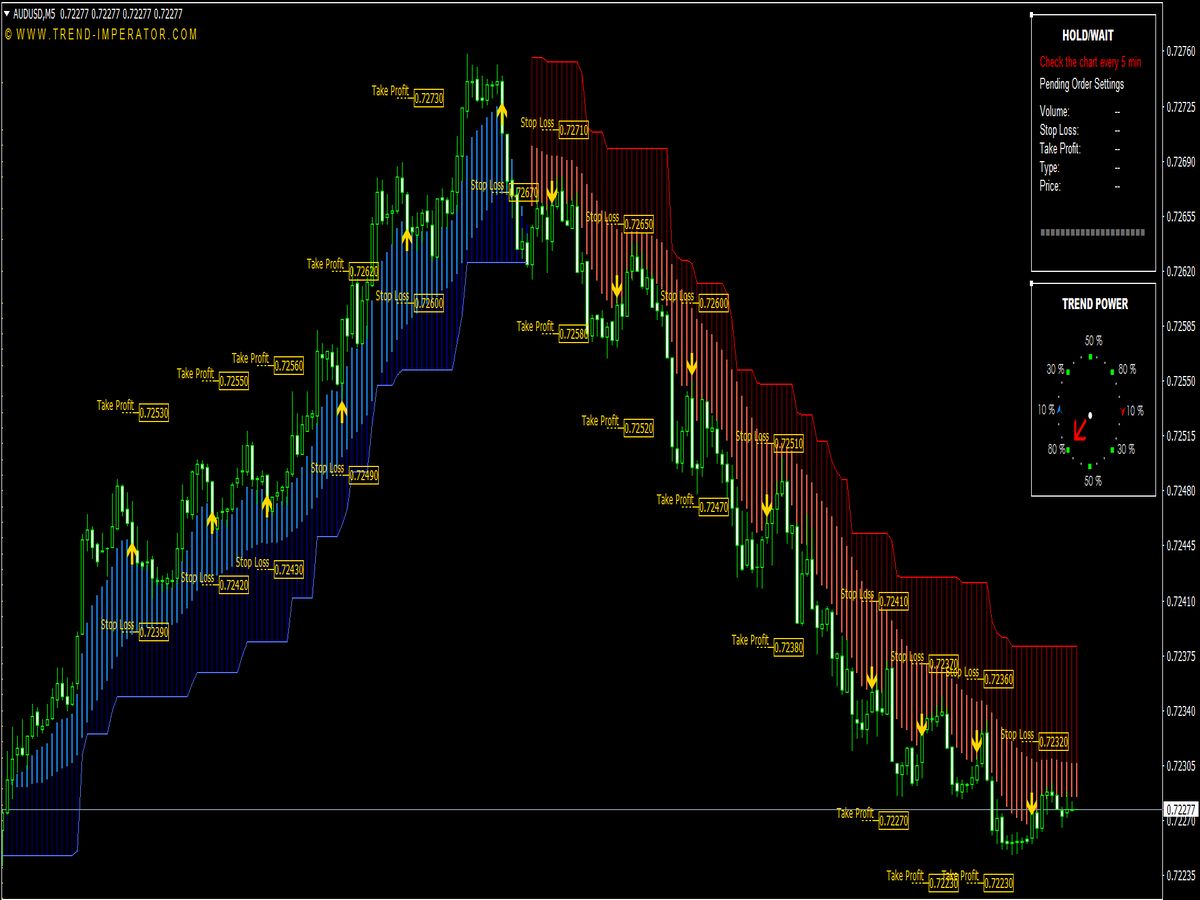
• Use the SuperTrend line as a dynamic stop-loss. As the price moves favorably, adjust the stop-loss to the SuperTrend line to lock in profits.
• Set a fixed risk-to-reward ratio (e.g., 1:2 or 1:3) to manage exits strategically.
9. Divergence with SuperTrend
• Look for divergence between price and the SuperTrend Indicator.
• If the price makes a new high while the SuperTrend does not, this indicates potential weakness in the trend. Enter a sell position on confirmation. Conversely, if the price makes a new low and the SuperTrend does not, it may indicate potential for a reversal and a buying opportunity.
10. Scalping with SuperTrend
• For day traders or scalpers, the SuperTrend can be employed for short-term trades.
• Enter quick buy and sell trades based on the SuperTrend signals on lower time frames (like 5-minute or 15-minute charts), looking for small price movements.
11. Avoiding False Breakouts
• Use volume analysis in conjunction with SuperTrend to confirm breakouts.
• Only consider a buy signal as valid if accompanied by increased volume. Similarly, for sell signals, ensure there’s enough selling pressure before acting on the breakout.
12. Session Trading with SuperTrend
• Tailor the use of the SuperTrend Indicator to specific trading sessions (such as London or New York).
• Focus on trading during high volatility times based on the SuperTrend signals. Avoid trading during low-volume times to reduce the risk of false signals.
13. Backtesting and Strategy Optimization
• Regularly backtest SuperTrend strategies to evaluate performance.
• Use historical data to see how specific SuperTrend strategies would have performed. Adjust parameters like ATR multiplier and time frames based on results to refine trading strategies.
14. Combining with Other Technical Indicators
• Mix SuperTrend with other indicators to confirm trading signals.
• Consider pairing with indicators like Stochastic or ADX to add layers of confirmation before entering trades based on SuperTrend signals.
15. News and Events Filter
• Be aware of economic news and events that can create volatility and affect the reliability of SuperTrend signals.
• Avoid entering trades around major news announcements, and look to execute trades before or after significant market impacts.
These strategies can be tailored and combined according to individual trading styles and preferences, allowing traders to optimize their approach with the SuperTrend Indicator. Always remember to manage risk effectively to protect your trading capital.
