Submit your review | |
The Stochastic Oscillator is a classical indicator, one of the few leading indicators available to traders. Its main strength is that it is based on Support and Resistance and therefore generates stronger signals than most indicators. The Stochastic Oscillator was introduced by George Lane in the 1950s and is very simple in its calculation.
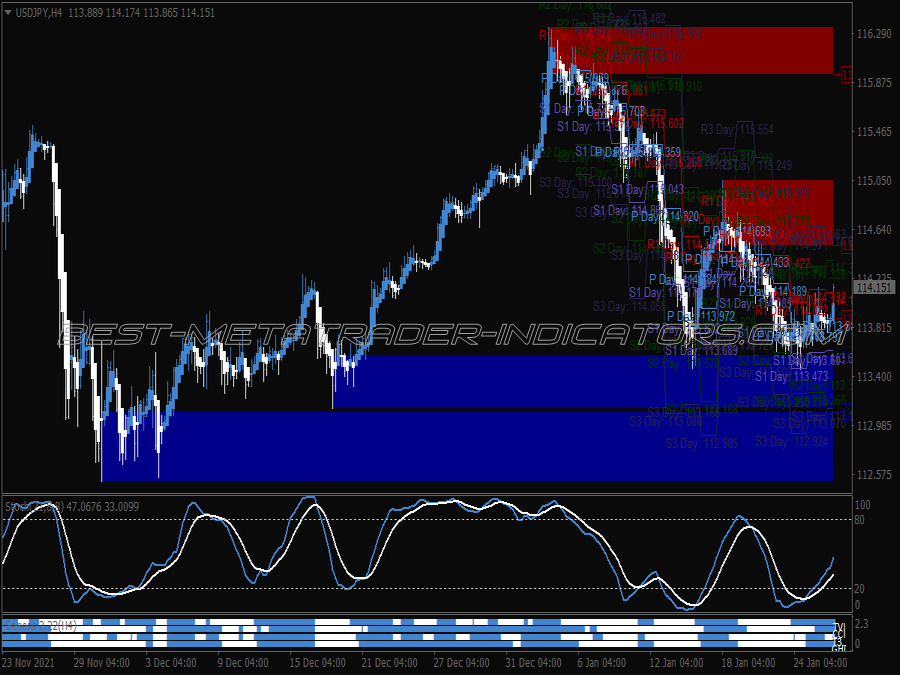
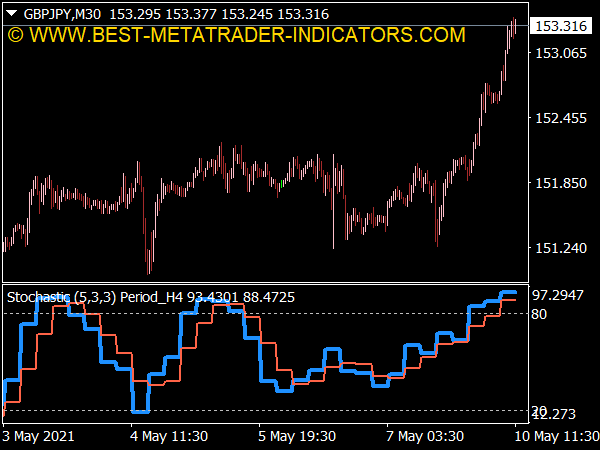
The Stochastic plots the location of price in relation to previous highs and lows. This value is later smoothed to create the Stochastic Main Line. The lowest low is usually a Support level, and the highest high is a Resistance level – so the Stochastic, in fact, shows the relation of price in relation to recent support and resistance levels. The Stochastic Oscillator offers traders several trading methods:
1. Overbought/Oversold
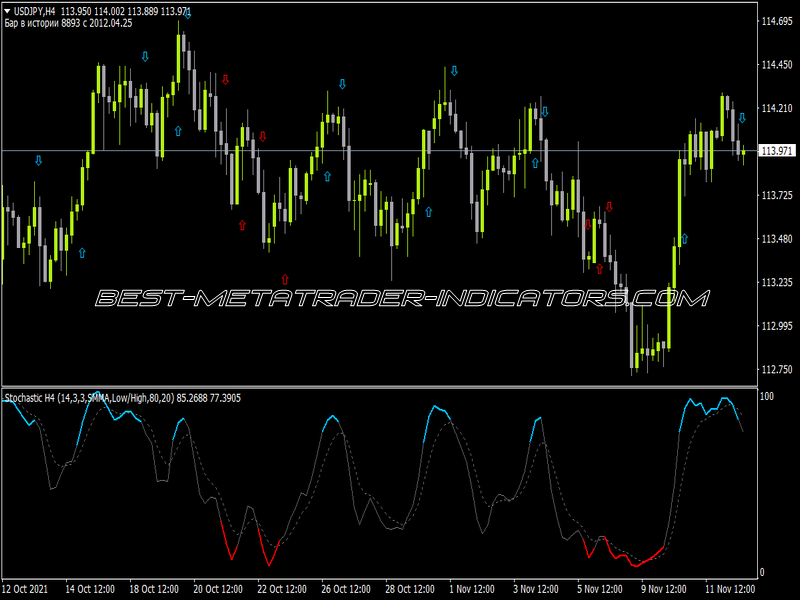
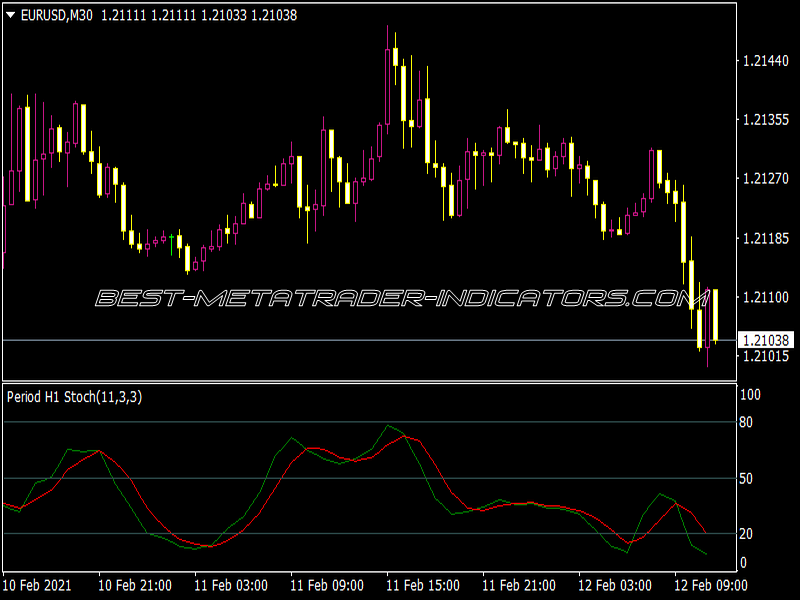
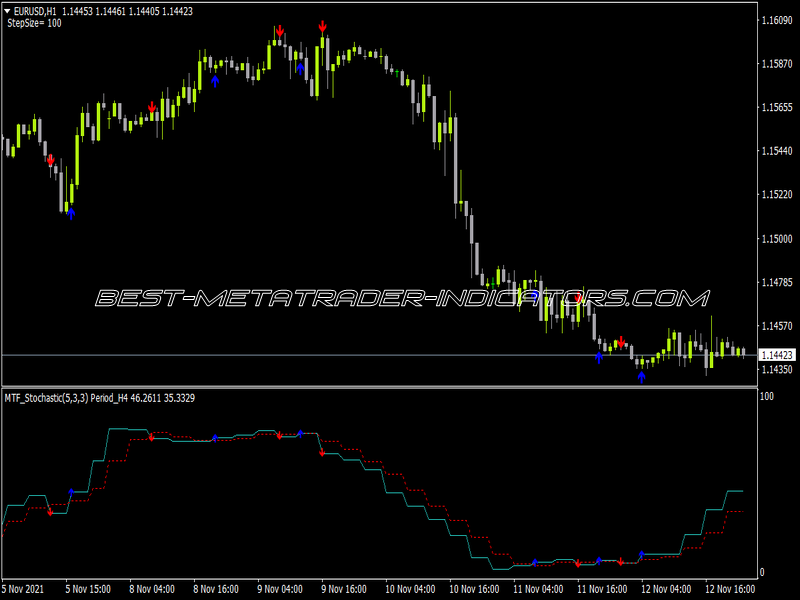
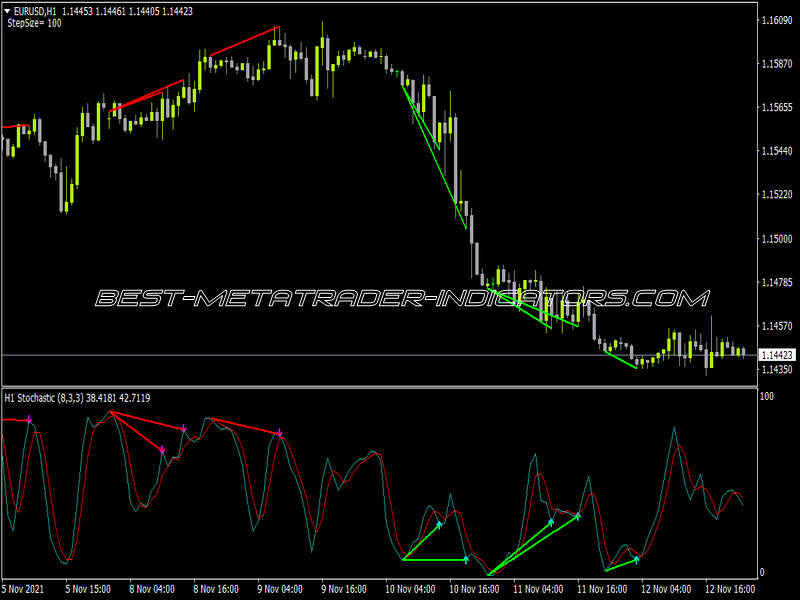
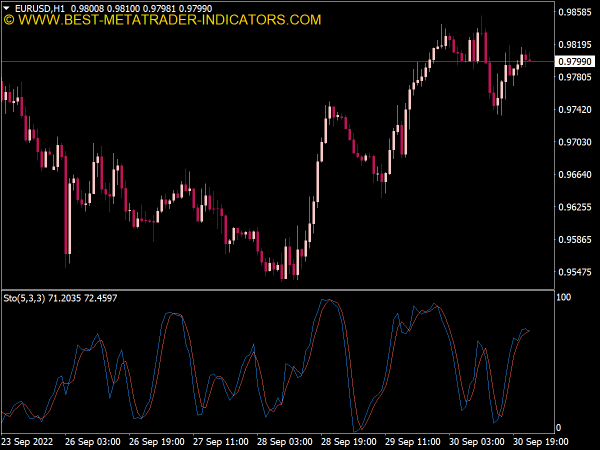
This is one of the strongest trading methods of the Stochastic Oscillator. It is based on a cross of a overbought-oversold level – when the Stochastic Oscillator crosses the 80 level from above a short trade is signaled, and when the Stochastic crosses the 20 level from below a Long trade is signaled.
The logic behind this method is simple: At an oversold level, price is close to a support level and the cross indicates that price respects that level and beginning to reverse. The opposite is true for Resistance and overbought level. However, make sure that price crosses quickly after reaching the level – if price stays too long in extreme levels it can indicate that price has broke the support or resistance, rather than reversed. This trading method is strong because it produces leading signals – it attempts to predict the reversal of trend using support and resistance. Unlike most indicators it does not follow the trend but predict its beginning.
2. %K %D Cross Method
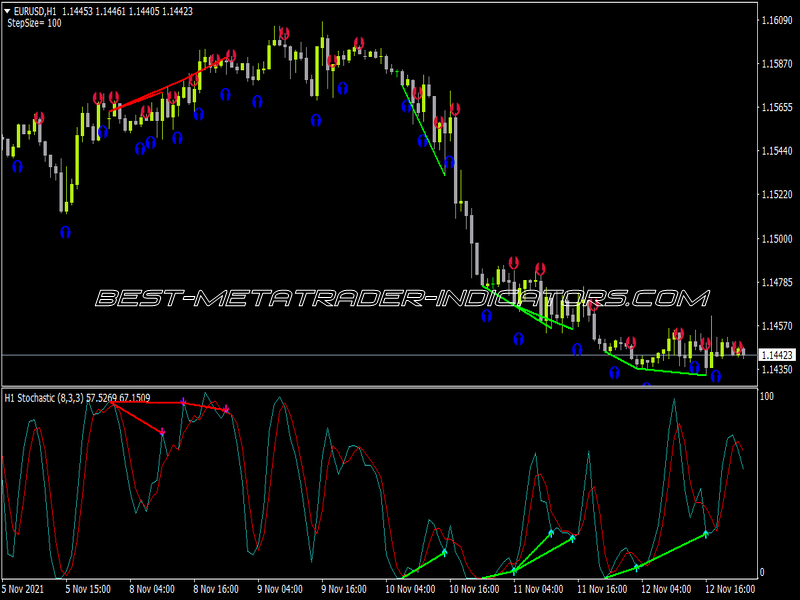
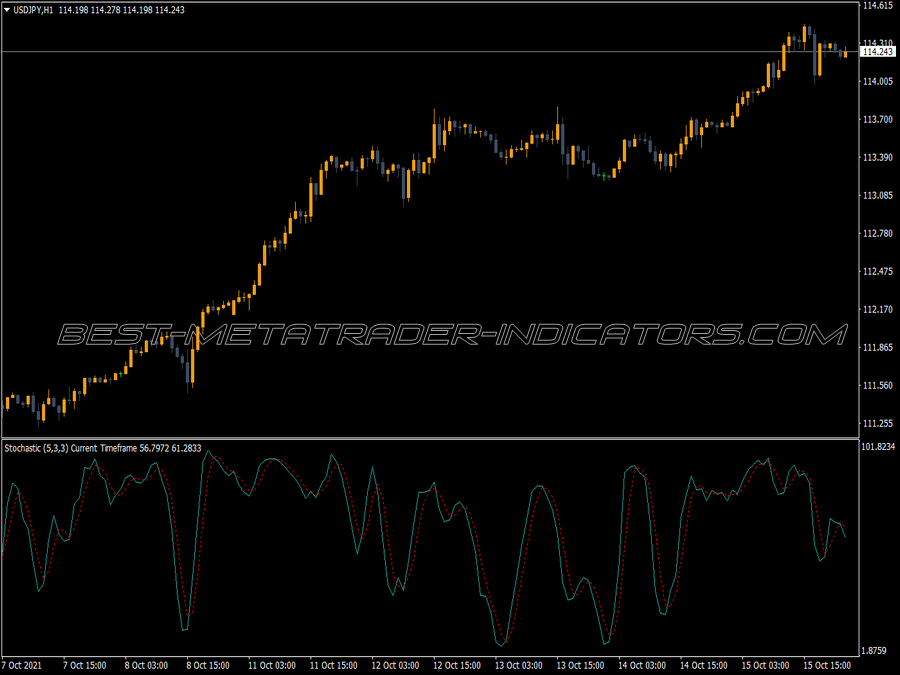
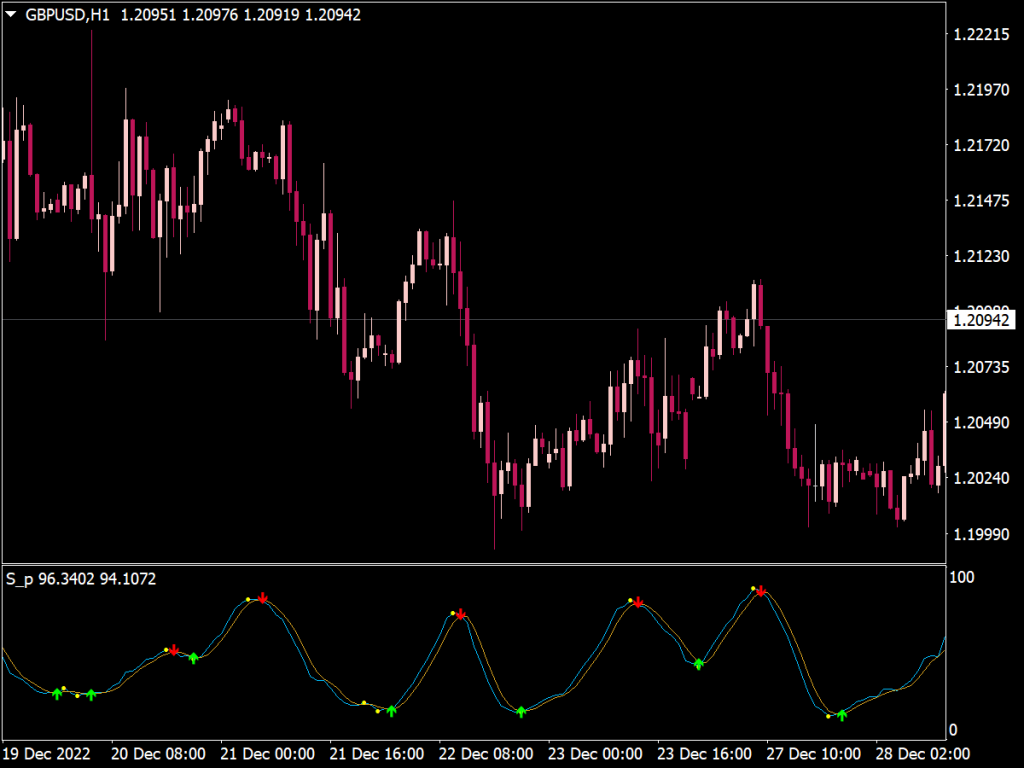
This is a trend-following approach to the Stochastic Oscillator. The signal are generated when the main line of the stochastic crosses the signal line. Crosses from below signal a long trade while a cross from above signal a short trade. This is a more trend-oriented approach to the Stochastic Oscillator. If it is combined with the first method it can generate much stronger signals – e.g.: demand that the cross happens in the overbought levels for short trades, or in the oversold for longs.
3. Zero-Line Cross
This is the trading method for trend-followers. Signals are generated when the main line crosses the 50 level. Crosses from below indicate a long trade while crosses from above indicate a short trade. Can be useful in trending markets but it usually produces lagging signals so it is not advisable.
Exceptional indicator. Found info on FF and I have fallen in love with it.
