Submit your review | |
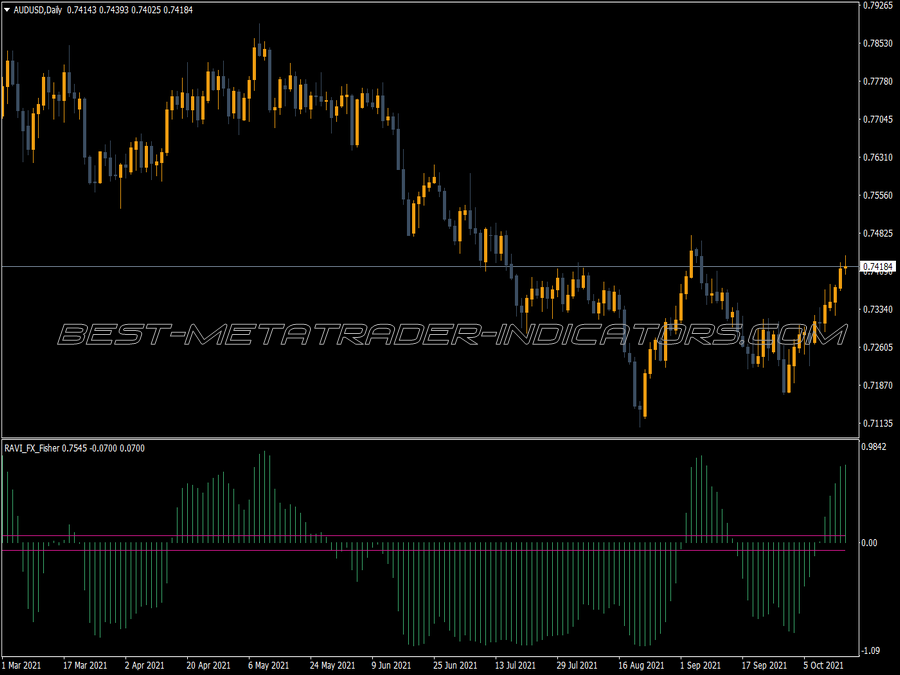
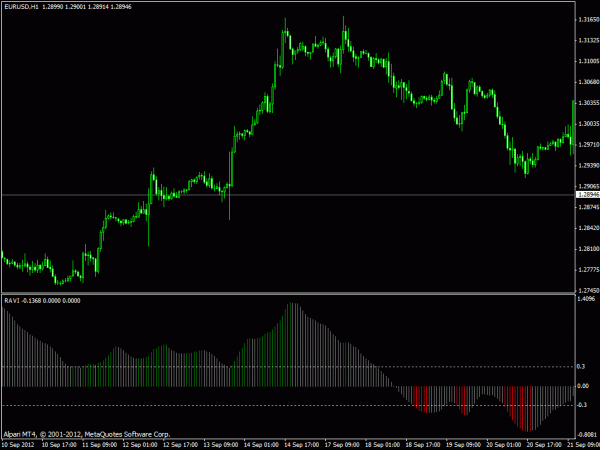
Tushar Chande's RAVI indicator is trying to further develop the ADX. It is the absolute value of a percentage difference between two MAs, whereby the shorter one should make up about 10% of the longer one. The original formula is:
Course * 100 * (7er MA – 65 MA) : 65er MA
At these values, the market is considered a trend market, if the RAVI is above 3%, below 3% is considered a sideways movement. For other values, the new values must be defined using the zone analysis. Values of less than 1% usually only occur after a prolonged absence of trends and are a sign that a trend will start very soon. Otherwise, the RAVI can be interpreted like the ADX.
The RAVI is significantly faster than the ADX and its patterns are more pronounced. It is therefore suitable for smaller trends. This gives a whole bunch of new trading opportunities that the ADX does not offer. Otherwise, however, it has the same shortcomings as the ADX and is also more difficult to interpret during longer trend phases, since it too often gives counter signals here, since it also indicates every minor trend or every minor trendlessness.
It is well suited for breakout methods, the ADX's approach to trading breakout systems, if it falls below 15%, would mean RAVI, below 0.5%.

