Submit your review | |
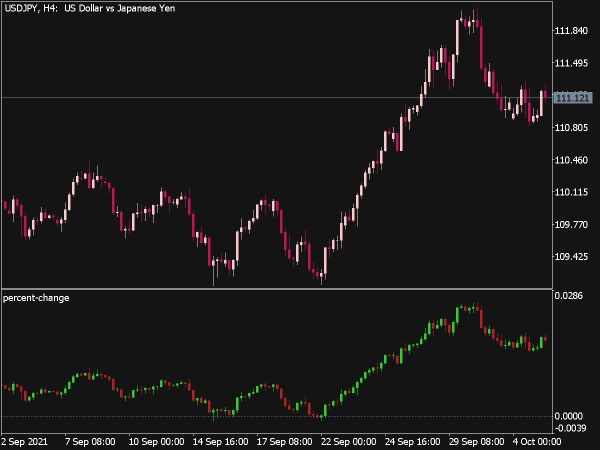
Rate of Change (RoC) indicator is a momentum oscillator that measures the percent change in price from one period to the next. In simple terms we can say the more the price change is, the more RoC changes. As market trends can speed up, slow down or can have a steady rate of progress, thus a leading indicator like RoC can be used to ascertain this speed.
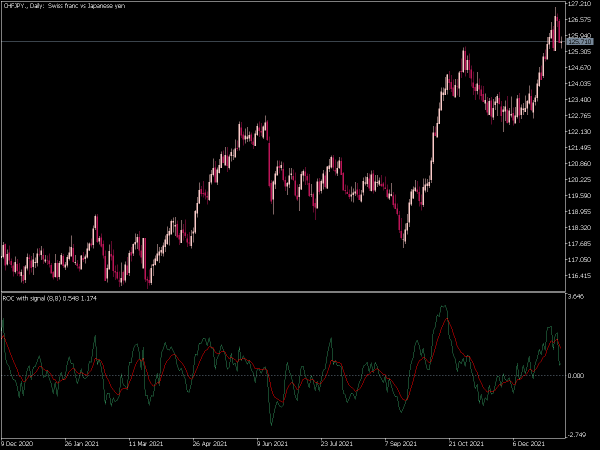
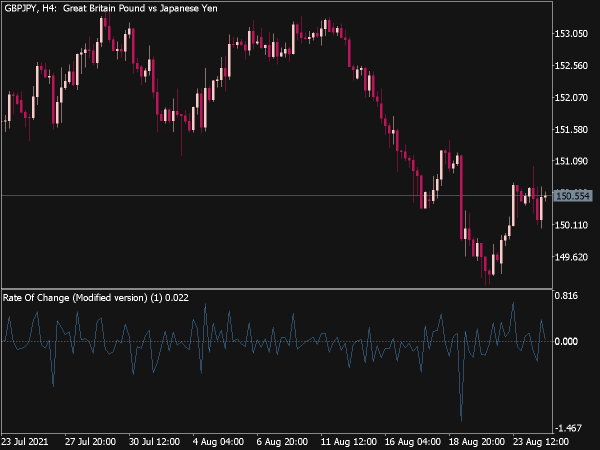
RoC oscillates around zero line, when RoC is above the zero line, prices are rising. Conversely, prices are falling when the RoC is below the zero line. RoC expands into positive territory as an advance accelerates. RoC dives deeper into negative territory as a decline accelerates. There is no upward limit on the RoC. There is, however, a downside limit. Any investment vehicle can only decline 100%, which would be to zero.
When we see RoC rising to a new peak, that means the optimism of the market is growing, and prices are likely to rally higher. When we see RoC falling to a new low, then that means pessimism of the market is increasing, and lower prices are likely coming.
Various periods of time are applicable, they are from the daily volatile chart that is taken of 1 day to the long period lasting up to 200 days and even more. The 12-day RoC and 25-day RoC are the widest spread for trading at short and medium periods.
When we see prices rise but RoC falls, we can say a top is likely possible in near future. This is an important signal to look for when taking profits from long positions, or tightening protective stop-losses. Similarly if we see prices hitting a new high but RoC reaches a lower high, then that means a bearish divergence has occurred, which is a strong sell signal. The corresponding bullish divergence is an obvious buy signal.
