Submit your review | |
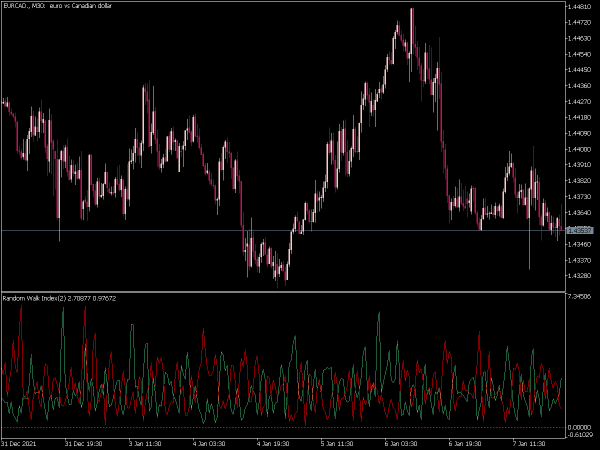
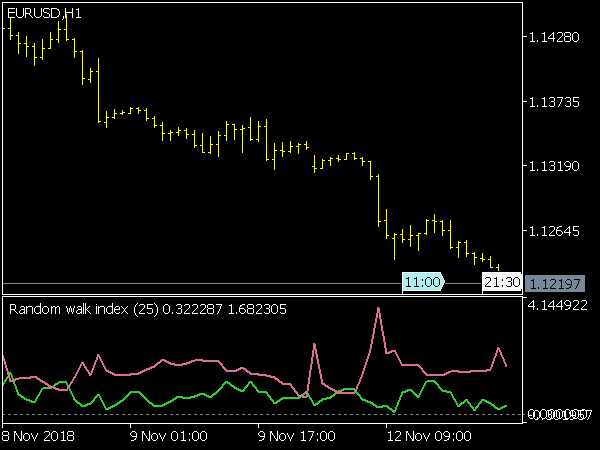
It was written by Michael Poulos. It is based on the assumption that some of the price movements are random. It divides the trading range of the price by the expected random value. Two indicators are created, the green one is the RWI upwards, the red one is the RWI downwards.
The higher the RWI rises, the higher the trend component of the market becomes, but the more likely a setback will also occur. The RWI thus combines characteristics of the trend indicators and the oscillators. The crossovers of both lines signal trend reversals. Depending on the market, the level from which a trend is assumed is 1.0 to 1.5. If both RWIs are below this, a sideways movement is assumed.
The RWI shows a very high reaction rate. This gives additional trading opportunities, but also increases the difficulties of interpretation. False signals accumulate in sideways and transitional phases. Poulos therefore recommends filtering the signals with a longer RWI and only using signals in its direction. It is also recommended to carry out a zone analysis, especially for breakout systems.
Poulos has developed a concept that links two RWIs of 64 and 7, the longer-term indicates a downtrend (RWI-down greater than RWI-up) and is above 1.0 then all tops of the short-term RWI-up above 1.0 should be used to build up short positions regardless of the position of the short-term RWI-down and vice versa.
