Submit your review | |
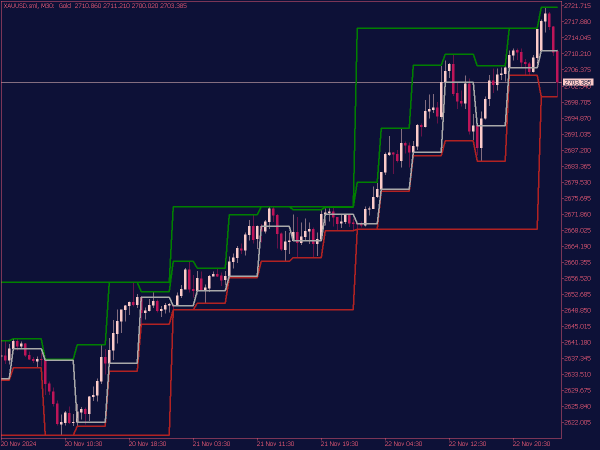
The MTF (Multi-Time Frame) High Low Indicator is a technical analysis tool used in trading to display the highest and lowest prices over multiple time frames on a single chart. This indicator helps traders identify key support and resistance levels, as well as potential trend reversals by providing a broader perspective on market behavior.
By analyzing high and low points across various time frames, traders can enhance their decision-making process, aligning their trades with prevalent market trends and improving their overall strategy.
Here are several trading strategies that you can implement using this Indicator:
1. Breakout Strategy: This strategy involves identifying key high and low levels across multiple time frames. When the price breaks above a significant high, it signals a potential buying opportunity, whereas a break below a significant low may indicate a sell signal. Traders should use confirmation from higher time frames to increase reliability.
2. Reversal Strategy: Traders can look for reversal patterns at the high or low levels indicated by the MTF indicator. For instance, if the daily high level holds strong while the hourly charts show price rejection, it may suggest a reversal. Always consider additional confluence factors, such as candlestick patterns or oscillator divergence.
3. Trend Continuation Strategy: This strategy focuses on trading in the direction of the trend. Utilize the MTF High Low Indicator to identify the prevailing trend on higher time frames, then seek long trades near the low levels or short trades near the high levels on lower time frames. This allows traders to enter trades that align with the overall market direction.
4. Confluence Zones: By combining the MTF High Low Indicator with other technical indicators (e.g., moving averages or Fibonacci retracement levels), traders can look for confluence zones where these levels meet. Entering trades around these confluence areas can enhance the odds of success.
5. Risk Management: Regardless of the strategy, implementing proper risk management is crucial. Define your entry and exit points based on the MTF High Low levels, and always use appropriate stop-loss and take-profit levels to safeguard your capital.
6. Time Frame Alignment: Analyze the indicator across multiple time frames simultaneously. This will give insight into the overall market sentiment and help avoid trades that go against the trend. For instance, if the daily chart shows an uptrend but the 15-minute chart hits a high level, it may be wise to wait for a corrective pullback before entering a long position.
7. Combining Volume Analysis: Pay attention to volume levels when price reaches high or low indicators. Increased volume on a breakout can confirm the strength of the move, while low volume on price rejection could signal a potential reversal.
8. Divergence Analysis: Look for divergences between price action and the MTF High Low Indicator. For example, if price makes a higher high, but the indicator does not, it could signal a weakening trend and potential reversal.
By employing these strategies, traders can harness the advantages of MTF High Low Indicators to create a more structured trading plan. Always remember that no single strategy guarantees success, and combining multiple approaches along with sound risk management can significantly enhance your trading performance.
📌 Great Indicators and Trading Systems for MT4 or MT5
- Best-Rated MetaTrader Indicators


- Nonlag MA MACD MTF

- Heiken Ashi MTF Smoothed…

- ATR MTF Indicator for MT5

- Donchian Channel Sl MTF Indicator

- Gann High Low Activator Jma

- RMA MTF Indicator

- Multi Time Frame (MTF) Aroon Indicator
 Aroon Indicator")
- Trend Trigger Factor JMA MTF Indicator

- Gann High Low Activator SSL Alert

- Tymen Starc Bands MTF Indicator

- Parabolic SAR MTF Indicator for MT5

- Py High Low Indicator

- Averages MTF Indicator

- ADX Trend Smoothed MTF Indicator

- New High & New Low Index

- Acceleration Deceleration AC…

- MTF Candle Indicator for MT5

- Candels High Open Indicator

- Jurik Volty MTF Indicator

- Historical Volatility Bands (High/Low)
")
- Non-Repainting and Non-Lagging Indicators