Submit your review | |
The Fractal Indicator, designed by Bill Williams, serves as an effective tool for traders seeking to identify potential reversal points in market trends. By recognizing patterns of five consecutive price bars, traders can establish buy or sell signals, enhancing decision-making in volatile markets. In this guide, we will explore various trading strategies utilizing the Fractal Indicator, complete with defined entry points and complementary techniques for better results.
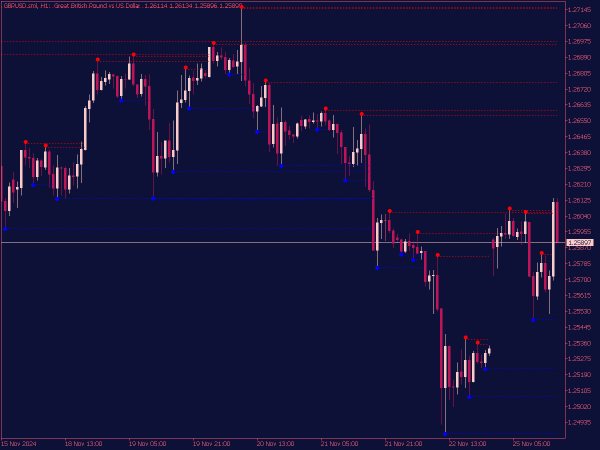
Before delving into strategies, let's clarify how the Fractal Indicator operates. A fractal signal consists of five price bars where:
Bearish Fractal
The middle bar has the highest high among the five bars, indicating a potential reversal point for downward movement.
Bullish Fractal
The middle bar has the lowest low among the five bars, signaling a potential reversal point for upward movement.
These fractals can be used independently or in combination with other indicators to reinforce trading decisions.
Strategy 1: Trend Reversal Using Fractals
This strategy focuses on identifying when the market may reverse its current trend, providing traders with optimal entry points.
Entry Points:
1. Bearish Fractal: When a bearish fractal forms at the peak of an upward trend, enter a sell position just below the low of the fractal bar. Set a stop-loss above the highest high of the last few bars to protect against unexpected market movements.
2. Bullish Fractal: Conversely, when a bullish fractal forms at the bottom of a downtrend, enter a buy position just above the high of the fractal bar. Use a stop-loss below the lowest low of the preceding bars.
Confirmation: Before entering a trade, confirm the fractal signal with additional indicators such as the Relative Strength Index (RSI) or Moving Average Convergence Divergence (MACD) to ensure alignment with market momentum. For instance, look for an RSI crossing below 30 for a bullish entry and above 70 for a bearish entry.
Strategy 2: Fractals and Moving Averages
Combining the Fractal Indicator with Moving Averages can provide a clearer picture of market trends, offering better entry points.
Entry Points:
1. Moving Average Crossover: Use a short-term moving average (e.g., 10-period) and a long-term moving average (e.g., 50-period). Buy when the short-term moving average crosses above the long-term moving average and a bullish fractal has just formed. Enter the trade above the fractal high.
2. Sell Signal: If the short-term moving average crosses below the long-term moving average, sell when a bearish fractal is confirmed, entering just below the fractal low.
Risk Management: Employ a trailing stop-loss method based on the moving average distance to maximize profits during trending conditions while protecting against reversals.
Strategy 3: Fractals in Range Trading
Range trading with the Fractal Indicator can yield significant rewards in sideways markets, capitalizing on price oscillations between established support and resistance levels.
Entry Points:
1. Support Fractal: If a bullish fractal forms near a defined support level, enter a buy order just above the fractal high.
2. Resistance Fractal: If a bearish fractal forms near a defined resistance level, enter a sell order just below the fractal low.
Exit Strategy: Utilize the same support and resistance levels for exiting trades. For instance, close the buy position when the price approaches the resistance zone. This method helps traders capitalize on predictable price ranges.
Strategy 4: Combining Fractals with Fibonacci Retracement Levels
Incorporating Fibonacci retracement levels into your trading strategy can enhance the effectiveness of the Fractal Indicator by pinpointing key levels of support and resistance.
Entry Points:
1. Fibonacci Support and Bullish Fractal: During an uptrend, if a bullish fractal forms at a significant Fibonacci retracement level (e.g., 61.8%), enter a buy order above the fractal high. The confluence of the fractal with Fibonacci levels reinforces the validity of the entry point.
2. Fibonacci Resistance and Bearish Fractal: In a downtrend, if a bearish fractal forms at a major Fibonacci level, enter a sell order below the fractal low. This strategy benefits from the historical significance of Fibonacci levels in determining price behavior.
Strategy 5: Multi-Time Frame Analysis with Fractals
Using fractals across different time frames can provide deeper insights and more reliable signals, allowing traders to align their positions with larger market trends.
Entry Points:
1. Higher Time Frame Confirmation: Identify fractal signals on a higher time frame (e.g., daily) and validate these signals on a lower time frame (e.g., 1-hour). For instance, if a bullish fractal appears on the daily chart, look for a corresponding fractal signal on the hourly chart to enter a buy position above the fractal high.
2. Trend Direction: Always ensure that your lower time frame signals align with the trend set by the higher time frame to enhance trade reliability.
Conclusion
The Fractal Indicator is a versatile tool that can significantly enhance trading strategies when combined with other methods. By employing strategies designed around trend reversals, moving averages, range trading, Fibonacci retracement, and multi-time frame analysis, traders can identify optimal entry points and manage risks effectively. As with all trading strategies, thorough backtesting and risk management are crucial to adapting these methods to suit individual trading styles and market conditions.
