Submit your review | |
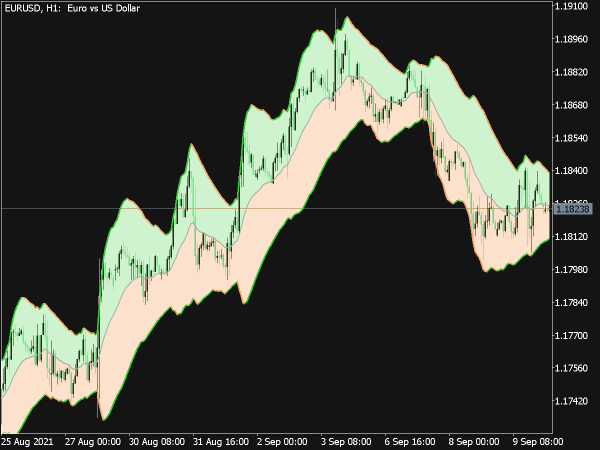
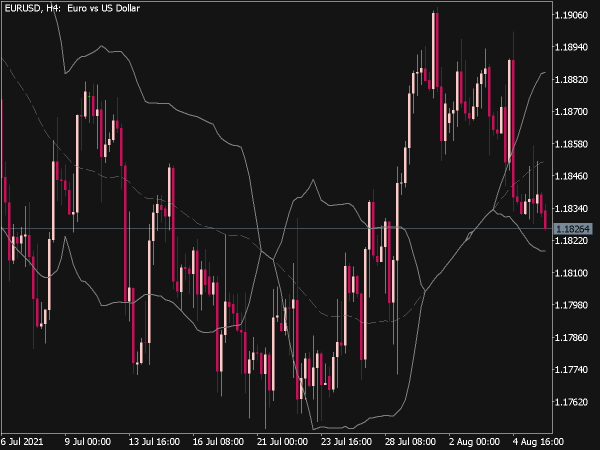
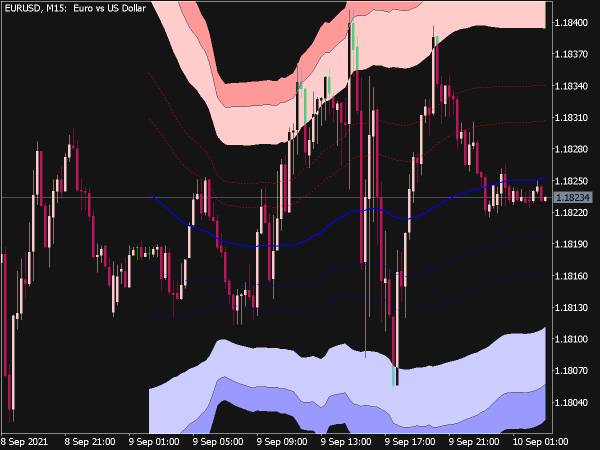
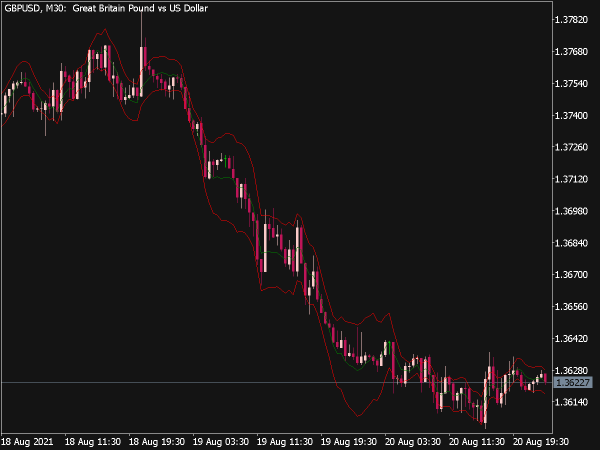
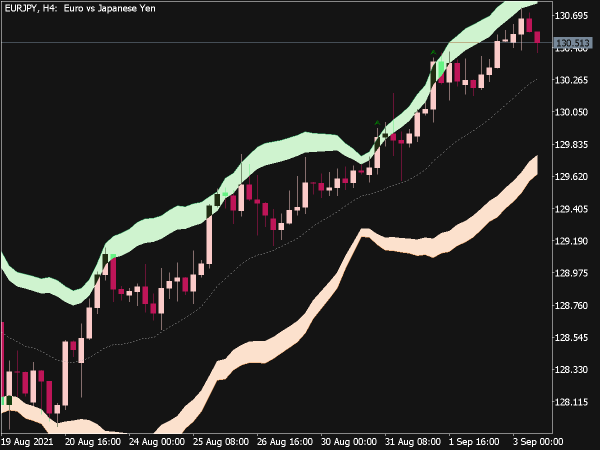
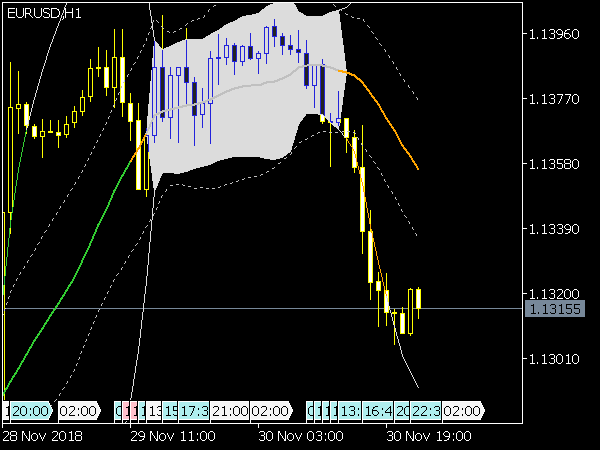
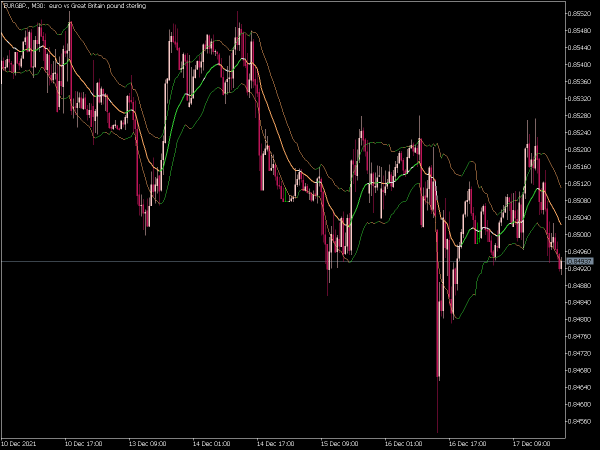
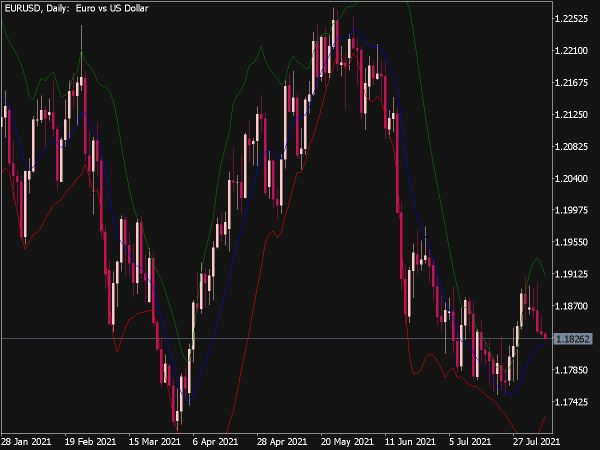
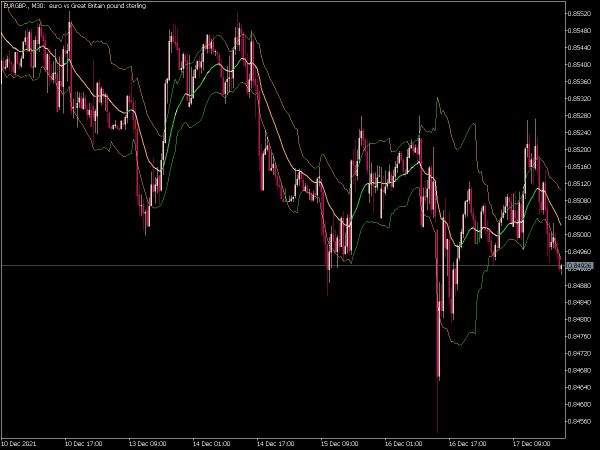
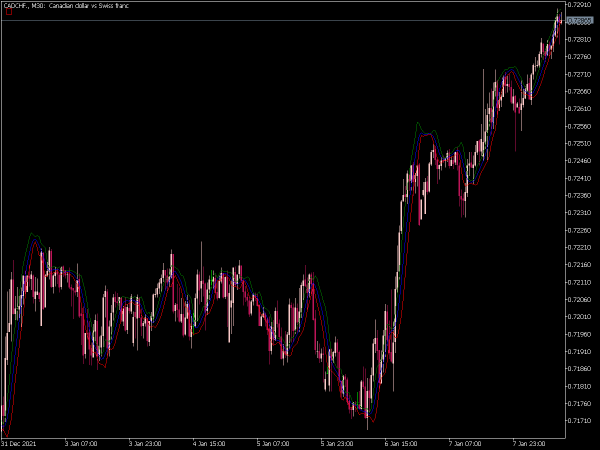
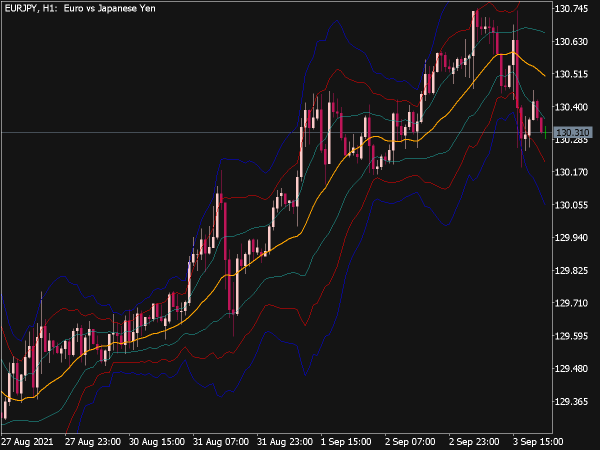
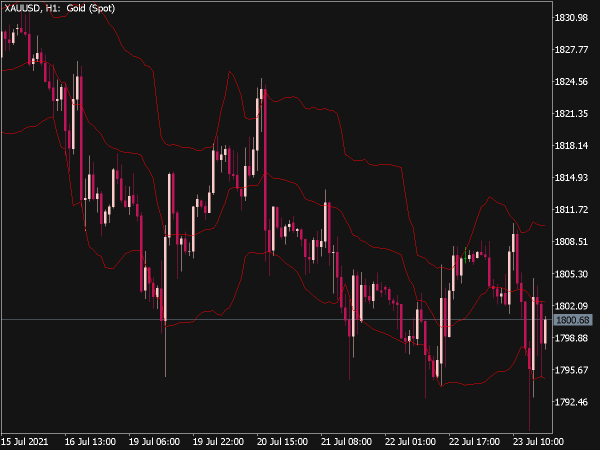
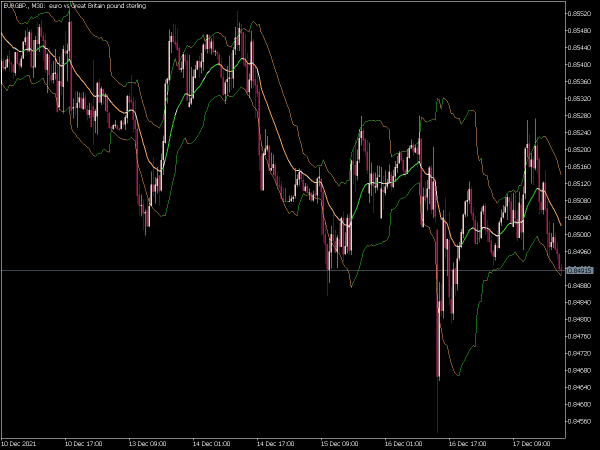
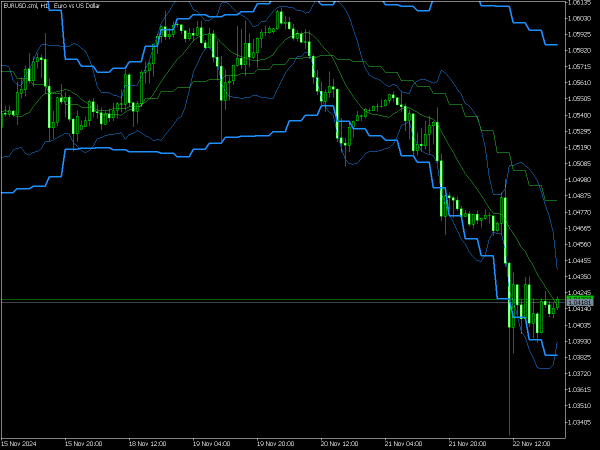
The MTF (Multi-Time Frame) Bollinger Bands Indicator is a technical analysis tool that uses the standard Bollinger Bands concept, which consists of a middle line (the simple moving average) and two outer bands that represent volatility (typically set at two standard deviations from the middle line). The MTF version allows traders to visualize and analyze Bollinger Bands across multiple time frames simultaneously, offering insights into market trends and volatility at different scales.
This can help in making more informed trading decisions by identifying potential entry and exit points based on the alignment of trends across various time frames. By seeing the bands from shorter to longer time frames, traders can better gauge momentum and reversals, enhancing their overall trading strategy.
Here’s an overview of effective trading strategies using this indicator:
1. Trend Confirmation: Use MTF Bollinger Bands across different time frames to confirm trends. For instance, if the daily chart indicates an upward trend (the price is above the upper band), check the 4-hour or 1-hour chart for bullish signals. Enter trades when lower time frames align with the prevailing trend observed on higher time frames.
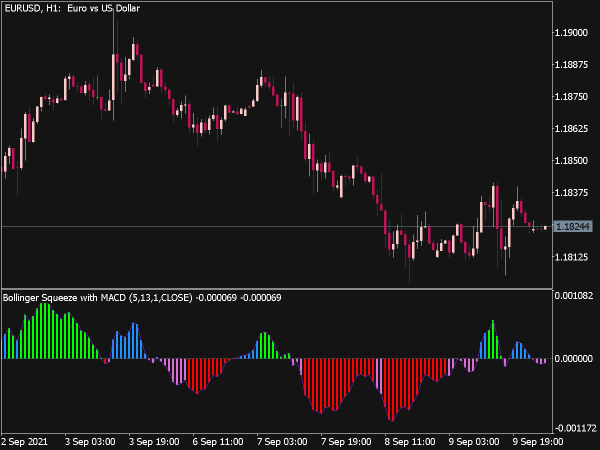
2. Bollinger Band Squeeze: A squeeze occurs when the bands contract, signaling low volatility which often precedes a price breakout. Monitor the MTF Bollinger Bands for squeezes on both the 4-hour and daily charts. Once the price breaks above or below the bands on the lower time frame, take action in the direction of the breakout while ensuring the higher time frame also supports the direction.
3. Mean Reversion: Capitalize on price moves toward the bands. If the price touches the lower band on the hourly chart, look for a reversal signal (like candlestick patterns or oversold stochastic) and confirm with the daily chart being within a range. Consider a long position when oscillators signal oversold conditions.
4. Divergence Trading: Look for divergences between price action and the indicator values. For instance, if the price makes a new low while the lower Bollinger Band does not, it may suggest a weakening bearish trend. Validate this divergence with indicators like RSI or MACD. Enter trades accordingly once you see confirmation from both the MTF Bollinger Bands and other indicators.
5. Breakout Strategies: Set alerts for price levels that break above the upper band or below the lower band on a chosen lower time frame (like the 15-minute chart). If confirmed by a breakout above the higher time frame band (like the daily chart), trade in that direction with a predefined risk management strategy.
6. Volume Confirmation: Use volume indicators alongside MTF Bollinger Bands to help confirm trends or reversals. For example, high volume during a breakout above the upper band on a 1-hour chart emphasizes the strength of the breakout, whereas low volume may suggest a lack of conviction.
7. Stop Loss and Take Profit Placement: Utilize the bands to devise strategic stop losses and take profit levels. Place stop losses just outside the bands and set take profit targets according to risk-reward ratios based on the volatility indicated by the bands.
8. Scalping Strategy: For short-term traders, employing MTF Bollinger Bands on minute charts (like 5 minutes and 15 minutes) can provide quick trades. Look for price action that consistently bounces off the bands, entering trades with quick profit targets before volatility expands.
9. Combining with Other Indicators: Enhance strategies by using MTF Bollinger Bands with other technical indicators such as Moving Averages or Fibonacci retracements to increase the reliability of entry and exit points. Confirm signals provided by the bands with these indicators, looking for confluence.
10. Seasoned Market Conditions: Different strategies apply based on market conditions. In trending markets, focus on breakouts and trend following strategies, while in ranging conditions, revert to mean strategies utilizing the bands to identify support and resistance levels.
In implementing these strategies, it’s important to conduct thorough backtesting and keep up with market news and events, as they can significantly affect price movements and the effectiveness of Bollinger Bands. Always stay adaptable and open to tweaking your strategies as market conditions change.
