Submit your review | |
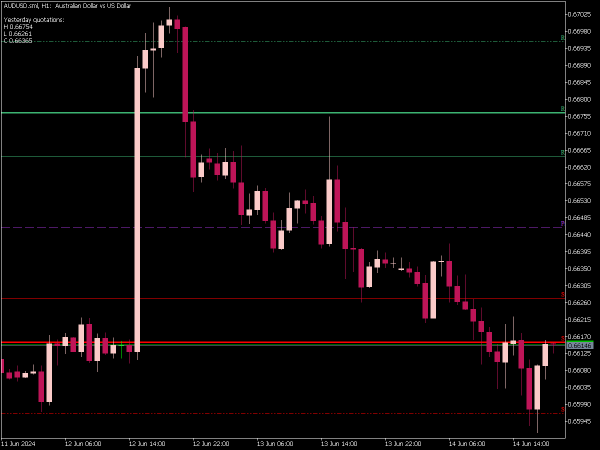
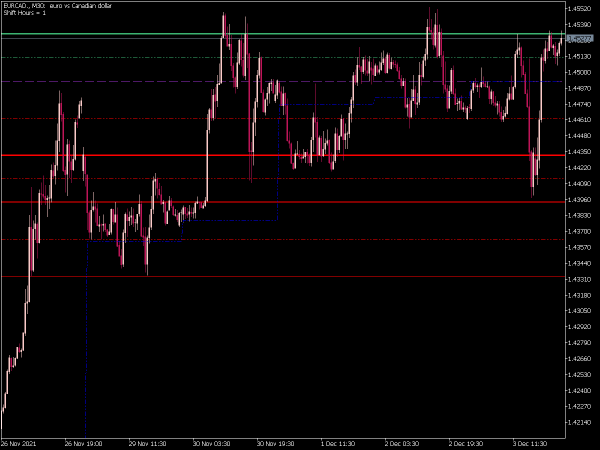
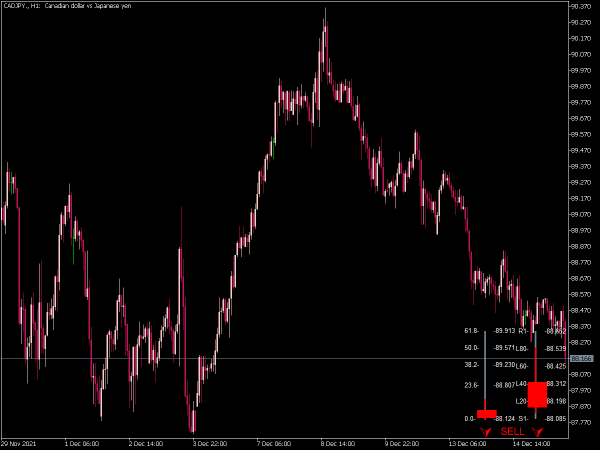
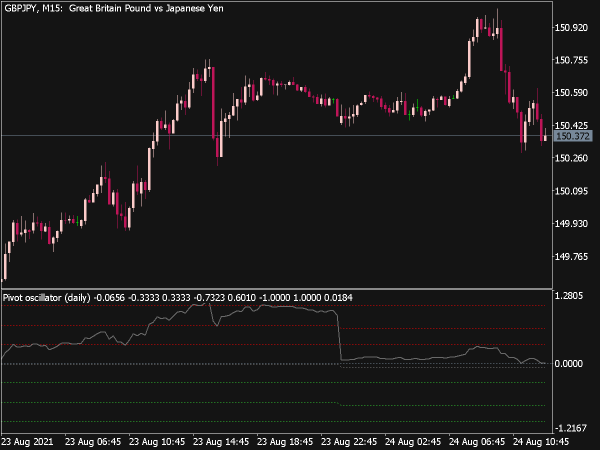
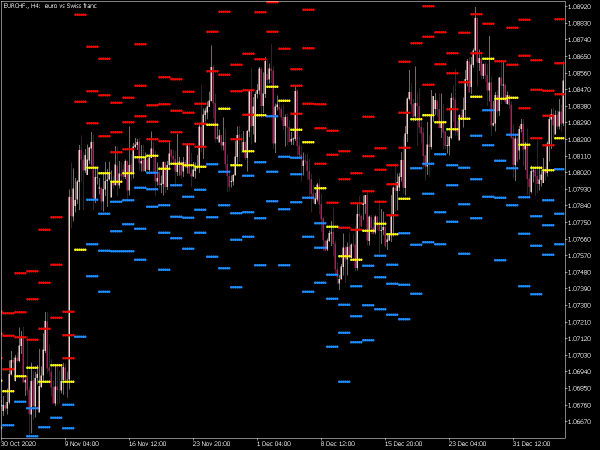
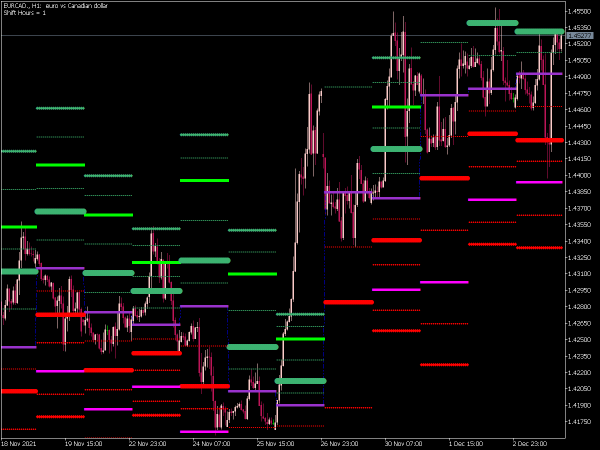
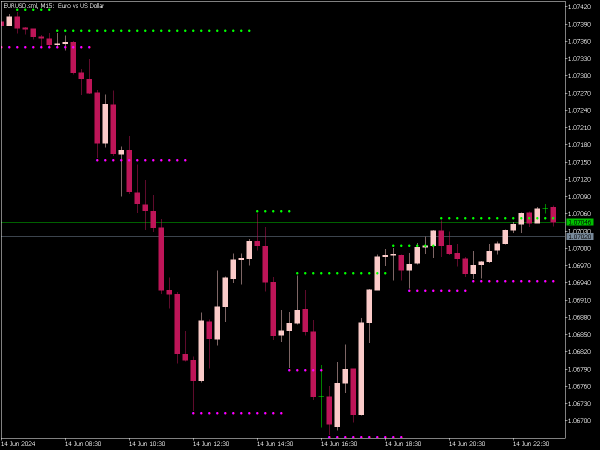
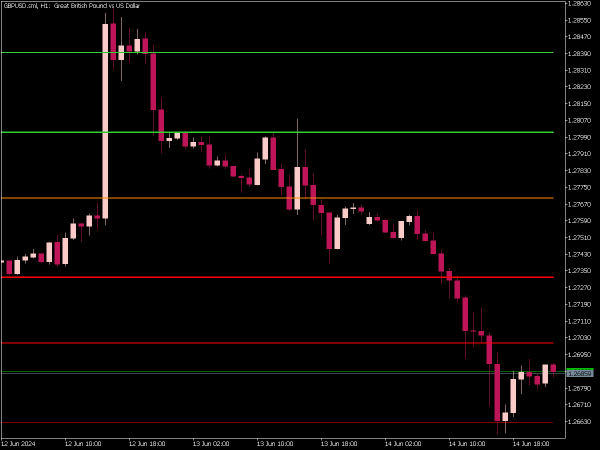
Pivot points are technical analysis tools used by traders to identify potential support and resistance levels in the market. A pivot point is calculated based on the average of the high, low, and closing prices from the previous trading period, typically the day before. To effectively utilize pivot points in your trading strategy, consider the following tips:
1. Understanding Calculations: Calculate the main pivot point (PP) using the formula: PP = (High + Low + Close) / 3. From this, derive the support and resistance levels, which are crucial for identifying potential reversal points.
2. Identify Market Sentiment: Use the pivot levels to gauge market sentiment. If the price is above the pivot point, the market is typically bullish, while prices below indicate a bearish sentiment.
3. Trade with the Trend: Ideally, trade in the direction of the trend. If the market is above the pivot point, look for long positions at support levels; conversely, if it is below, look for short positions at resistance levels.
4. Combine with Other Indicators: Enhance the effectiveness of pivot points by combining them with other indicators, such as moving averages, RSI, or MACD, to confirm potential entry and exit signals. This can help filter false signals caused by market noise.
5. Time Frames Matter: Experiment with different time frames to adjust pivot point calculations. Daily, weekly, and monthly pivots can provide insights into longer or shorter-term trading strategies, depending on your trading style.
6. Risk Management: Implement strict risk management rules. Determine stop-loss placements based on the nearest support or resistance levels, ensuring that losses are minimized.
7. Watch for Breakouts: Pay attention to significant price movements around pivot points. A breakout above resistance signals bullish momentum, while a breakdown below support signals bearish momentum. This is where pivot levels can serve as entry signals.
8. Market Conditions: Be aware of broader market conditions and news events that might influence price movements. Volatile markets can lead to unpredictable price behavior around pivot points.
9. Analyze Past Performance: Review historical price action around pivot levels to gauge how effectively these levels have acted as support or resistance in the past. This can help you to anticipate future price behavior.
10. Adjust with Volatility: During periods of high volatility, pivot points may not hold as well. Consider using wider stop-loss orders and adjusting the calculation method to account for increased price ranges.
11. Utilize Price Action: Combine pivot points with price action strategies. Look for candlestick patterns at pivot levels (like pin bars or engulfings) to confirm potential reversals or continuations.
12. Use Breakout Strategies: Develop strategies focused on trading breakouts from pivot points. For example, you can enter a position when price closes above a resistance level with a strong volume confirmation.
13. Maintain a Trading Journal: Keep a detailed log of your trades using pivot points along with outcomes. This will help refine your strategies and improve your understanding of when and how to effectively trade these levels.
14. Stay Disciplined: Stick to your trading plan and avoid emotional trading decisions based on market noise. Rely on pivot points as part of your strategy, but always respect your risk management rules.
15. Practice Patience: Wait for confirmation from other indicators or price movements before entering a trade based on a pivot point. Impulsive trades can often lead to unnecessary losses.
By understanding how to calculate and utilize pivot points effectively, traders can enhance their trading strategies and improve their decision-making processes. Remember to continuously evaluate and adjust your strategies based on your trading performance and the overall market environment.
