Submit your review | |
Trend following is a trading strategy that aims to capitalize on the momentum of price movements in financial markets. Traders using this approach identify and trade in the direction of an established trend, whether upward (bullish) or downward (bearish), based on technical indicators or price patterns.
This method relies on the belief that assets that have been rising will continue to rise and those that have been falling will continue to fall, allowing traders to enter and exit positions to maximize profits while minimizing losses. It can be applied to various asset classes, including stocks, commodities, and currencies.
Here’s a list of some common trend following strategies:
1. Moving Averages: Utilize combinations of short (e.g., 10-day) and long-term moving averages (e.g., 50-day) to identify trends. A crossover strategy, where the short-term average crosses above the long-term average, signals a buy, while a crossover below suggests a sell.
2. Breakouts: Identify key resistance and support levels. Enter trades when the price breaks above resistance or below support, indicating a continuation of the trend. Confirm with increased volume for a more reliable signal.
3. Trend Lines: Draw trend lines connecting higher lows during bullish trends or lower highs during bearish trends. Enter trades when the price bounces off the trend line.
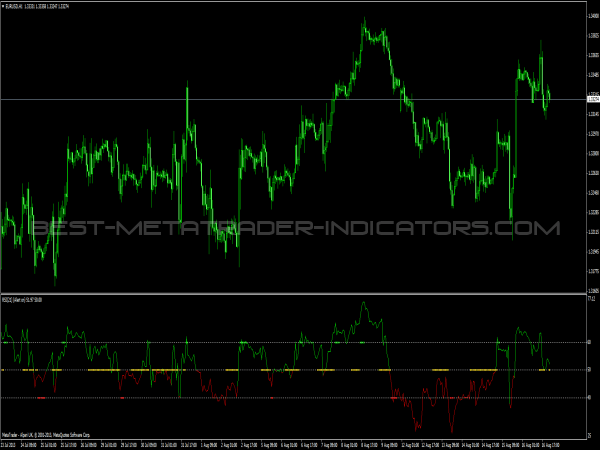
4. Relative Strength Index (RSI): Monitor the RSI for overbought or oversold conditions. Enter trades in the direction of the trend when the RSI shows a reversal from extreme levels, especially when it confirms the market trend.
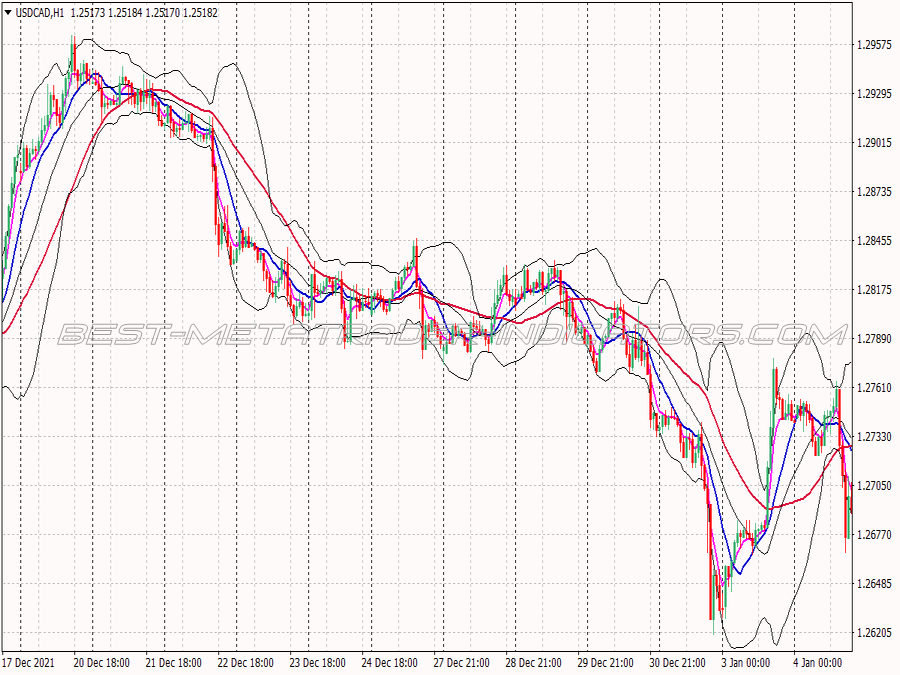
5. Bollinger Bands: Use Bollinger Bands to identify breakout opportunities. Enter a buy when the price closes above the upper band during an uptrend, and consider shorting when the price closes below the lower band in a downtrend.
6. MACD (Moving Average Convergence Divergence): Look for MACD crossovers. A bullish crossover (where the MACD line crosses above the signal line) can indicate a buying opportunity, while a bearish crossover suggests selling.
7. Fibonacci Retracements: After a significant price move, use Fibonacci retracement levels to identify potential reversal points. Enter positions aligned with the trend at these levels, assuming the trend will continue.
8. Ichimoku Cloud: Utilize the Ichimoku Cloud indicator for multi-faceted trend analysis. Enter trades when the price moves above the cloud in an uptrend or below the cloud in a downtrend.
9. Adverse Market Conditions: Be wary of entering in high volatility or when economic news is expected. Confirm trends and potential entry points using multiple indicators to enhance signal reliability.
10. Risk Management: Always incorporate proper risk management techniques by setting stop-loss orders based on technical levels to protect against unexpected market movements while allowing for trend continuation.
These strategies can be combined and adapted according to market conditions to enhance efficacy and reduce risks in Forex trading. Always implement risk management techniques to safeguard your capital.
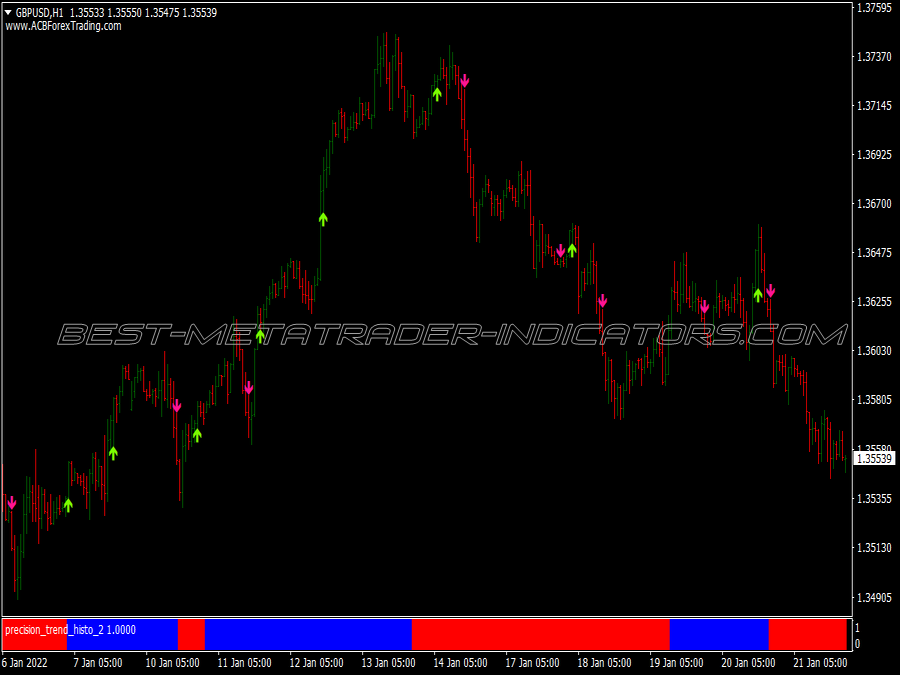
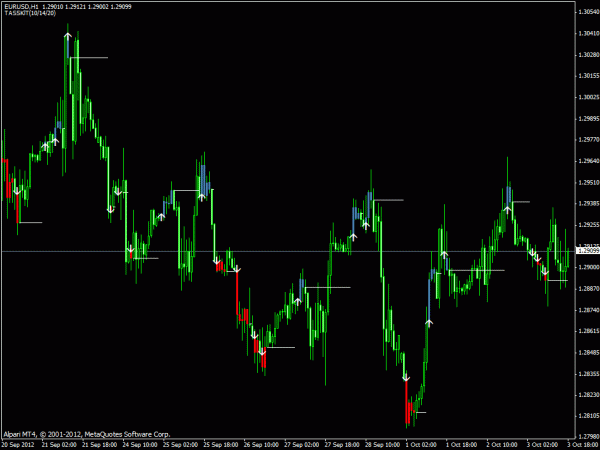
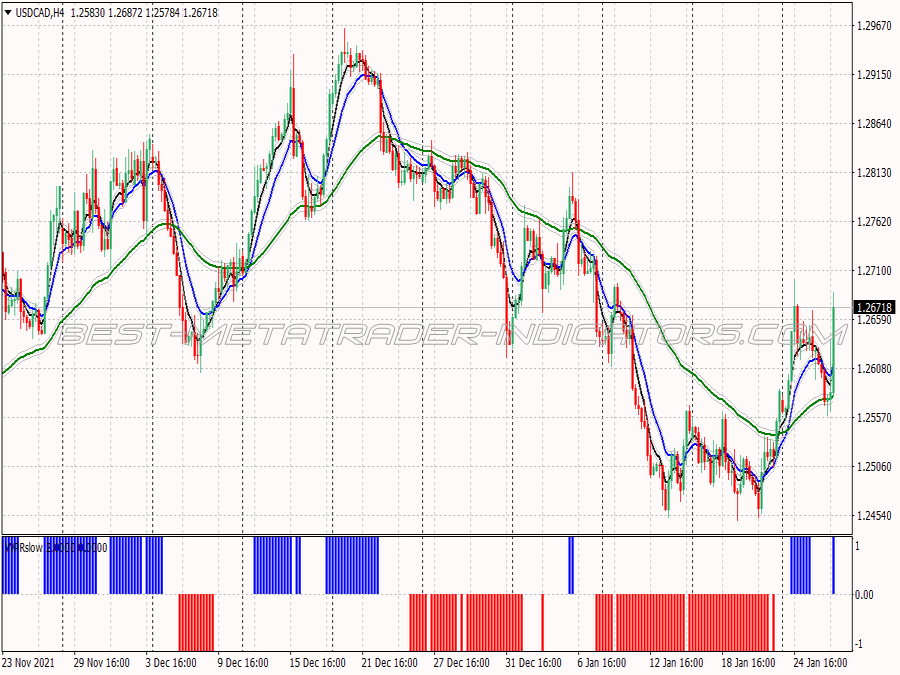
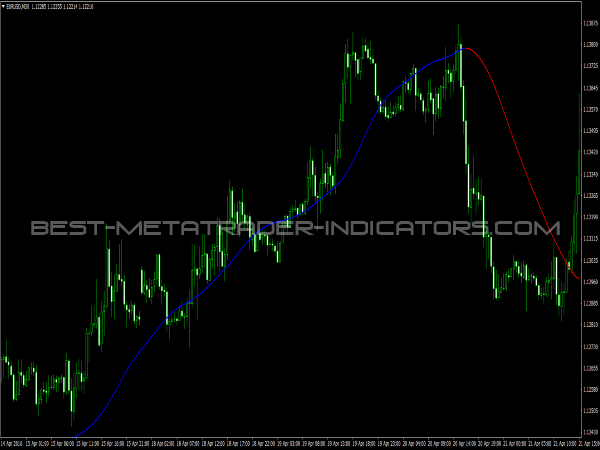
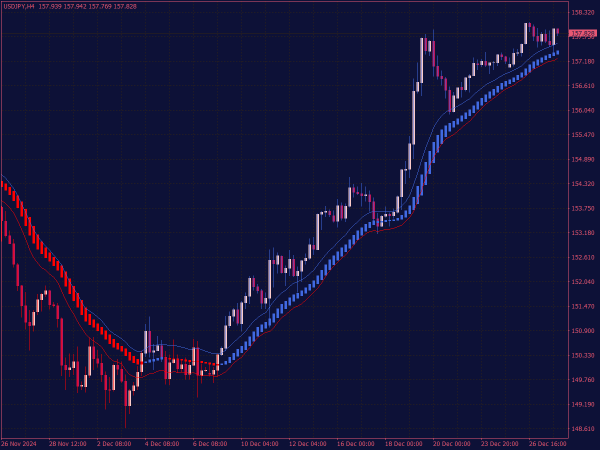
After a quick look at this.. simply a colored/visual help.. Its simply a 20 EMA, if price is below, indi paints red, if price above EMA 20 indi pains blue.. no need to clutter your chart more with this imo..

