Submit your review | |
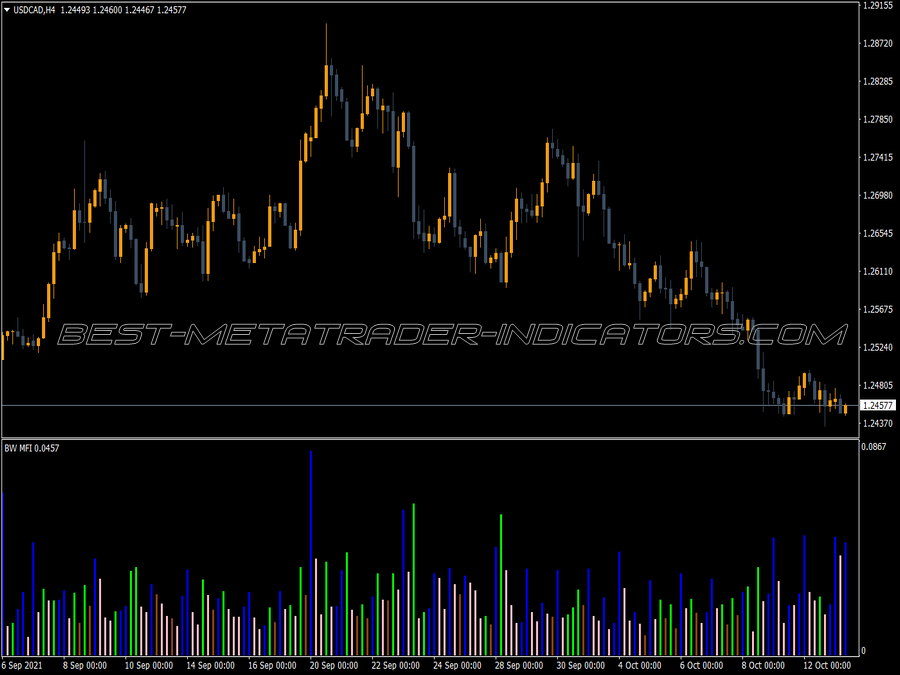
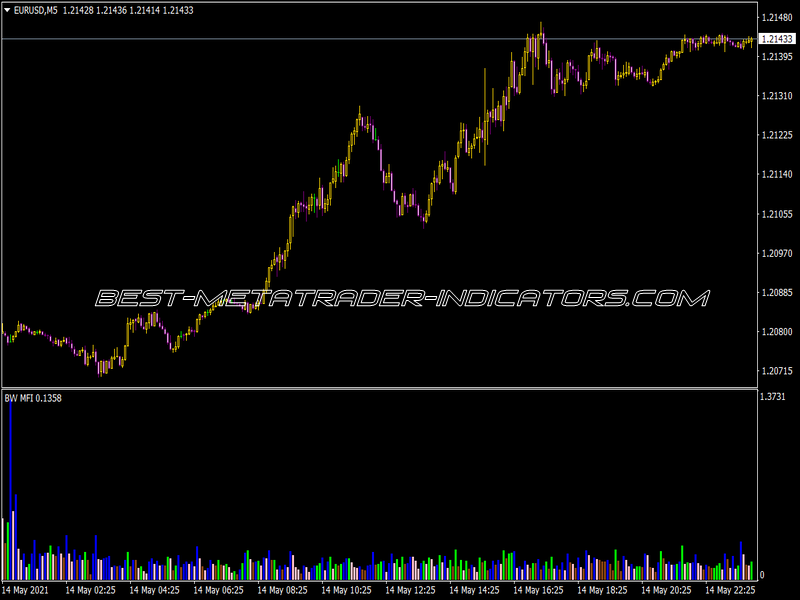
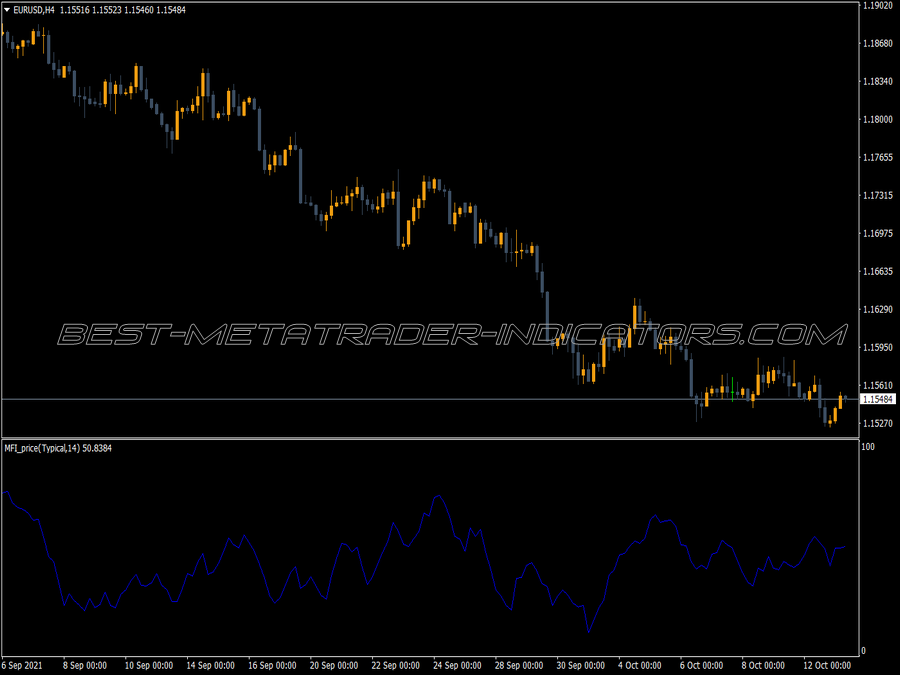
The starting point of the calculation is the so-called money ratio. The positive flow of money is divided by the negative. A positive cash flow is assumed if today's average price is greater than the previous day's and a negative one if the average price is smaller. The average price is then multiplied by the volume. The index is then obtained from the formula:
100 – ((100) / (1) + Money Ratio))
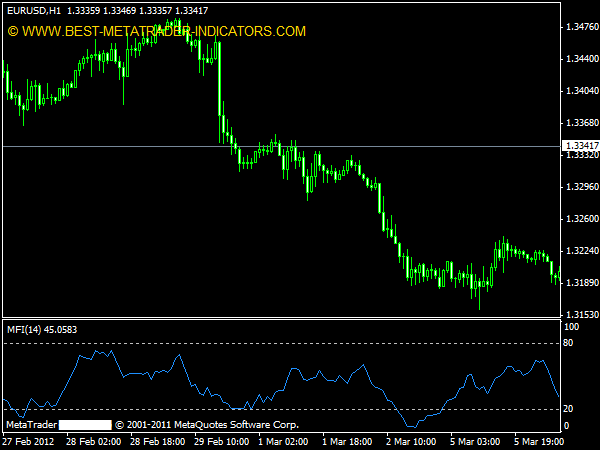
So it is a question of connecting the idea of the RSI with the volume. As with all other oscillators, false signals result in sideways movements and rapid trend reversals. However, these can be greatly reduced if trend indicators are switched in advance as filters. Furthermore, it is recommended to calculate an MA on the DSS and to take the crossovers as signals.
The basic idea of the money flow index is that accumulation occurs when two things are given: the stock closes constantly above the average price and a relatively high turnover occurs, because the whole thing is linked to the volume. In addition, the so-called money flow line is calculated, this is the accumulated money flow indicator, similar to the on-balance volume.
If a new high in the stock is not confirmed by a new high in the money flow line, this means that the supply-demand situation is slowly deteriorating. On the other hand, it is bullish to evaluate when the money flow line makes a new high before the prices, because usually the sales follow the prices.
By the way, Investors Business Daily uses this indicator as the basis of their rating system for accumulation/distribution. However, you can also find out there that the money flow index is not a miracle cure, it fails with V-tops and V-bottoms. Its signals, the divergences, only arise at tops that require longer periods of time.
