Submit your review | |
In identifying and gauging market strength, no indicator is better than the Momentum indicator. The Momentum indicator shows the trader the strength of buyers and sellers, the strength of current trend and helps the trader identify trends and ranges. The Momentum can be interpreted and traded in numerous ways:
Method 1: Identify Ranges and Trends
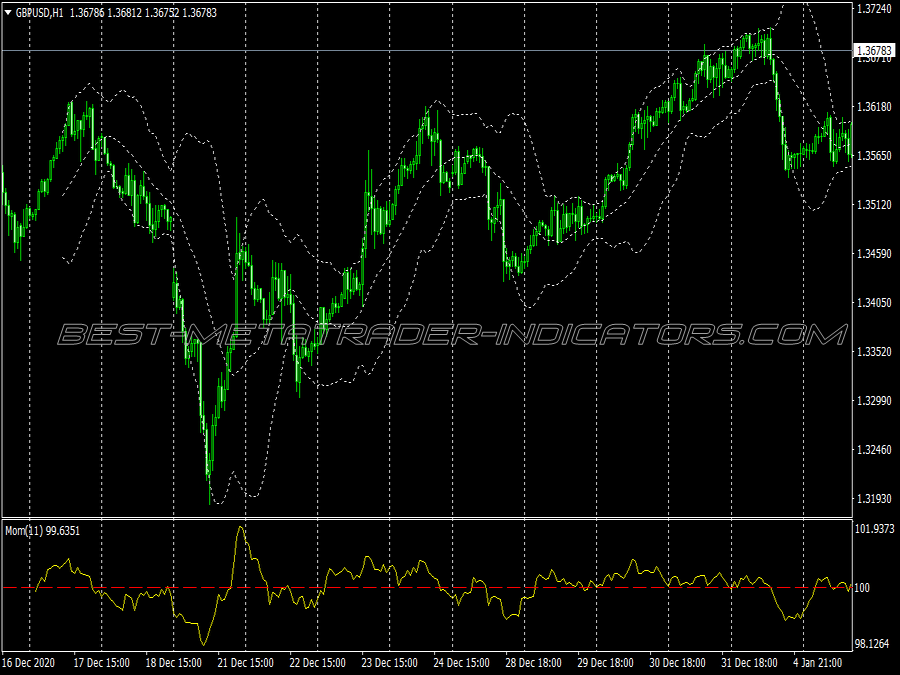
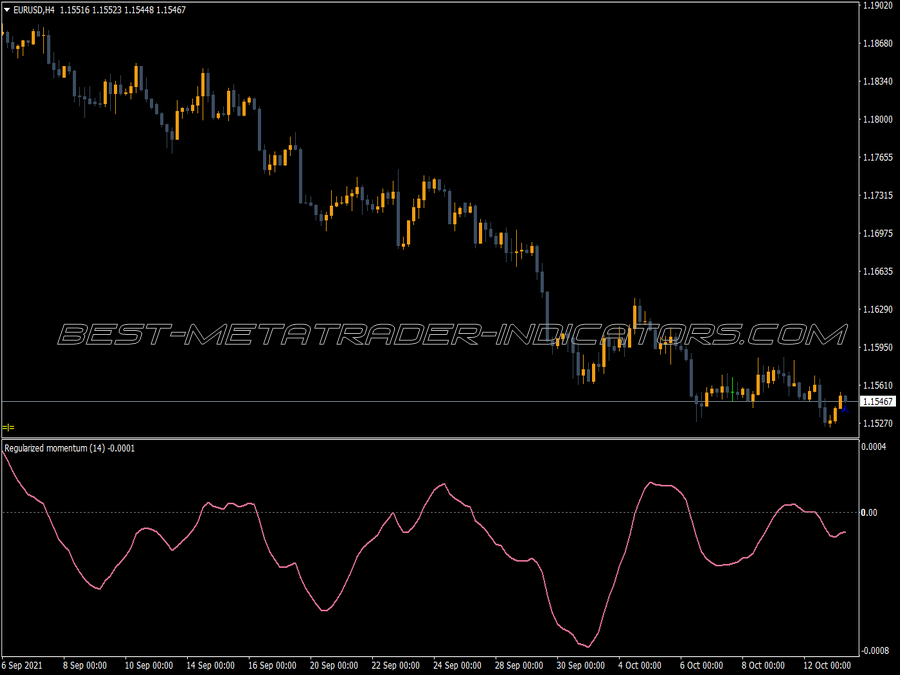
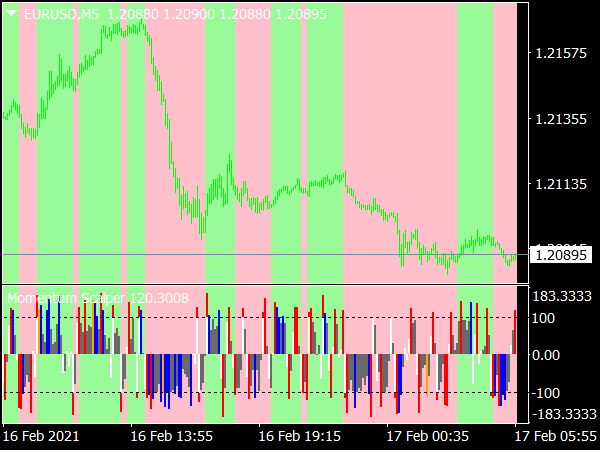
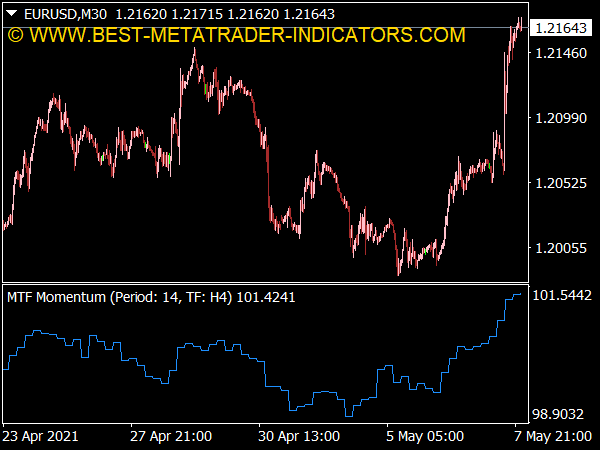
The Momentum indicator is useful in identifying ranges and trends. This is done by looking at the momentum values. Extreme values indicate that the trend is strong. It indicates that price is trending strongly and there's is a high probability of continuation of the trend. Values near 100 (center-line) indicate that price is in range. It indicates a low momentum and weak trend.
The main principle is that the more extreme the values (very high or very low), the stronger the trend and the more power the buyers or sellers have (buyers if the value is greater than 100, sellers if value < 100).
Method 2: Trend Line Break
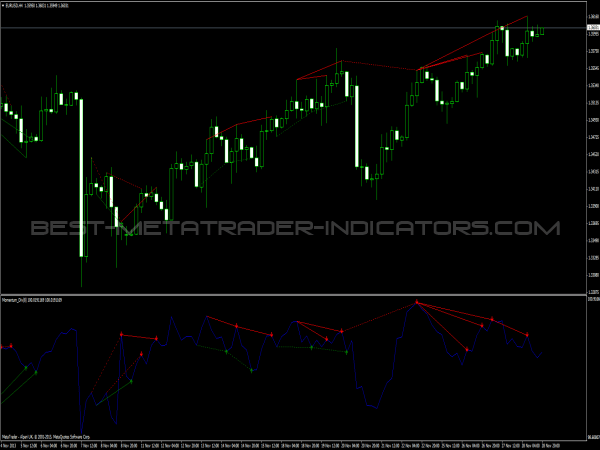
This method was first published at Martin Pring's great book (On Market Momentum). This book describes various trading techniques with the Momentum indicator and is recommended for further reading. The basis of this trading method is identifying Trend lines on the indicator and trading breakouts. Trades are entered in the direction of the breakout. This is a very accurate trading method that can produce very profitable results.
Method 3: Moving Average Smoothing
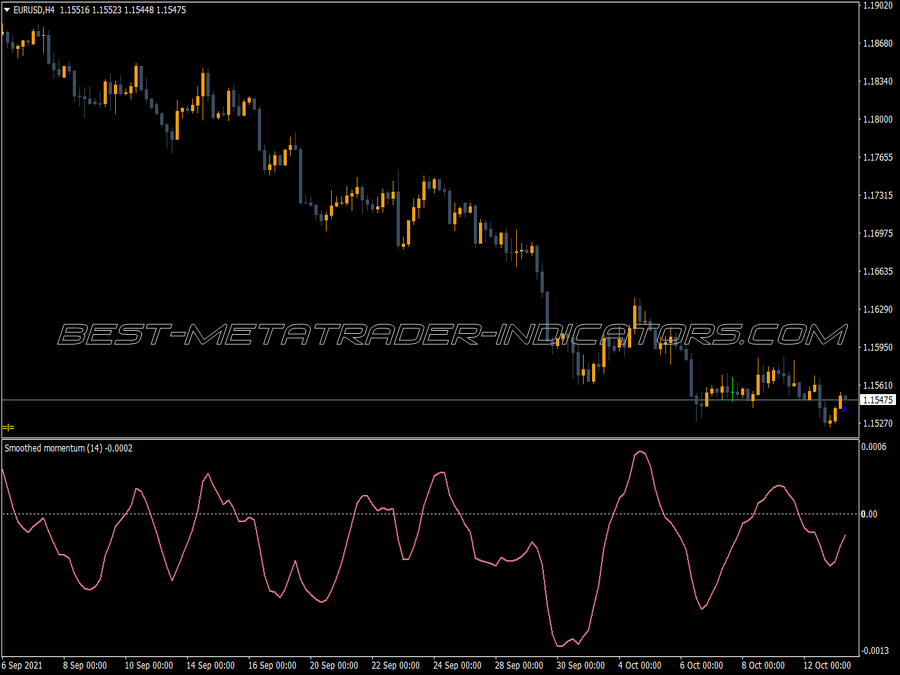
A trend-following approach to the indicator is to smooth it with a 20-period Moving Average and use the smoothed value for trading. When the MA crosses the zero line from below a long trade will be signaled, and when it crosses the center line from above, a short trade will be signaled.
