Submit your review | |
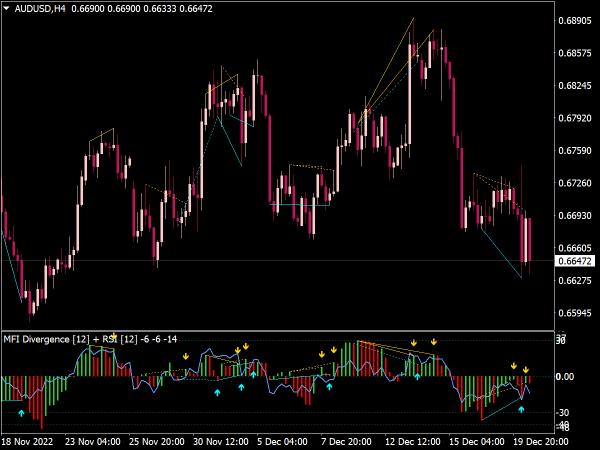
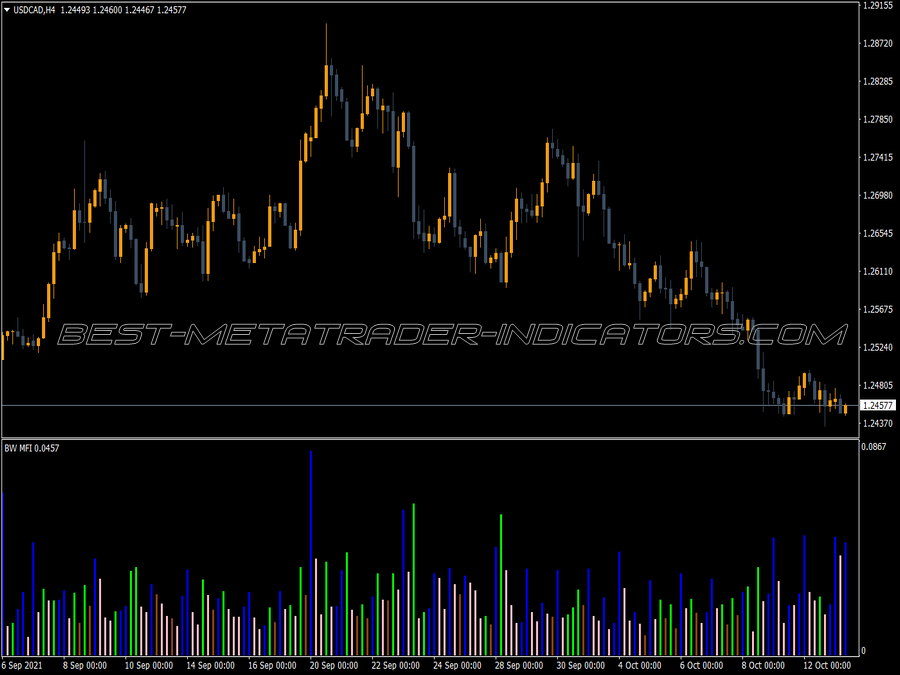
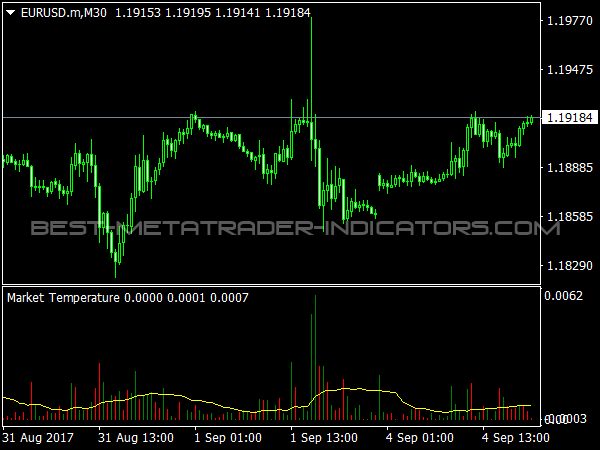
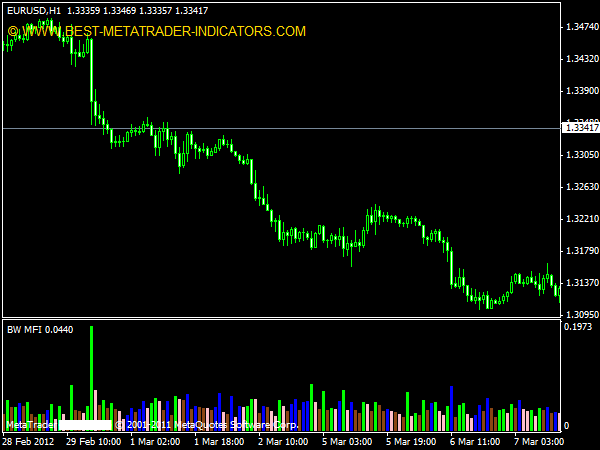
The MFI is actually an older indicator, it was known even before Bill Williams. However, it was considered useless, since it used to be calculated mainly on daily charts and there are such strong level changes that its calculation is pointless. However, it is quite useful on intraday charts, i.e. for day trading, you recalculate it here for each bar and divide the size of the bar by the tick volume.
Over time, you also automatically notice, without calculating, whether the MSI gets bigger or smaller if you have experience. The indicator is then suitable for giving signals quite early when a new trend begins. In addition, Bill Williams has now made a comparison between tick volume and MFI, whereby the first sign relates to the volume and the second to the MFI, giving him four market conditions.
Green (+ +):
With green, you should always be on board, i.e. already positioned, because this state usually does not last very long. It marks the strongest movements.
Fade (- -):
The longer this state lasts, the more likely it becomes that a larger movement will start. This corresponds to a decrease in volatility corresponding to a narrowing in the Bollinger bands. These movements are usually relatively large. However, this state is occasionally also found during peak formation, and usually at wave 1 in the Elliot pattern. If the following correction is over, however, then the strong wave 3 begins, so you should watch the market closely.
Fake (- +):
Here, too, larger movements can occasionally begin. More often, however, this is the sign of a trendless market in which the pros can chase the stops. Unfortunately, these two states cannot be distinguished. The distinction is most likely to succeed through time, if it is only a short breathing of the market before a major movement, this state of affairs does not last very long. On the other hand, if it stops, it is more of a trendless market that will commute back and forth.
Squad (+ -):
The squad is the most important signal, since most movements end in this state. It is also often found when a Fibonacci retracement is holding, a Gann line or a Murrey line is successfully resisting or supporting. However, this state of the market is occasionally also found in the middle of wave 3 of the Elliot pattern and wave 1 usually forms its top not with the squad, but with the fade state.
Basically, the squad always refers to a state of war between bulls and bears, which is then followed by an immediate decision. It should be noted that the sqad can occasionally occur without a reversal, usually at resistance points, such as Fibonacci lines, the market then takes a short break and continues. It is relatively difficult to distinguish both states.
You can also use the squad to make trades, but only if other indications strongly suggest it. On its own, it just shows the beginning of a resistance against the trend, without it being possible to say what will follow from it.
Like all volume indicators, the MFI works better with large volumes, so you have to go a time frame higher if a tick volume of 20 does not occur at least per bar. Bill Williams interprets this variant of the MFI along with other features of his market observation system.
