Submit your review | |
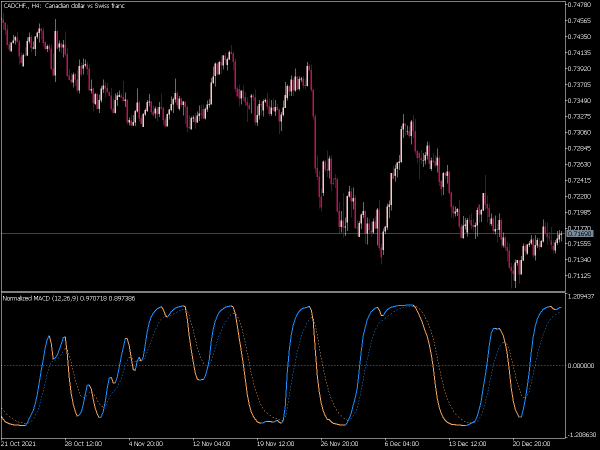
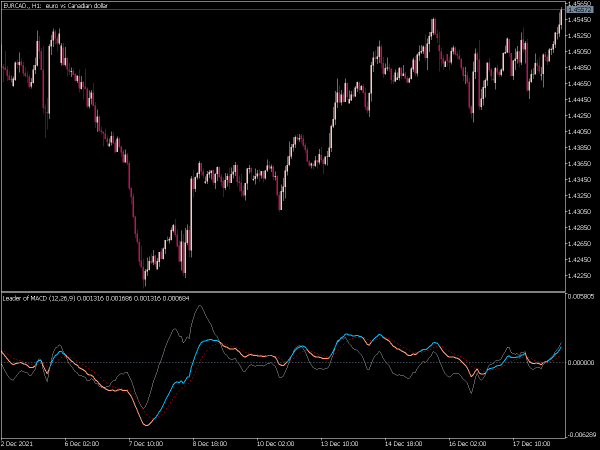
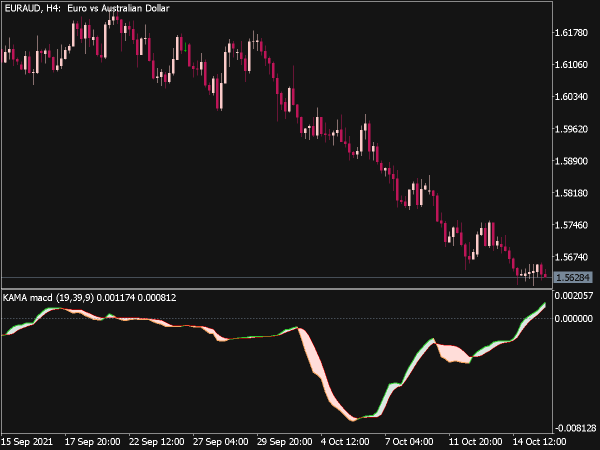
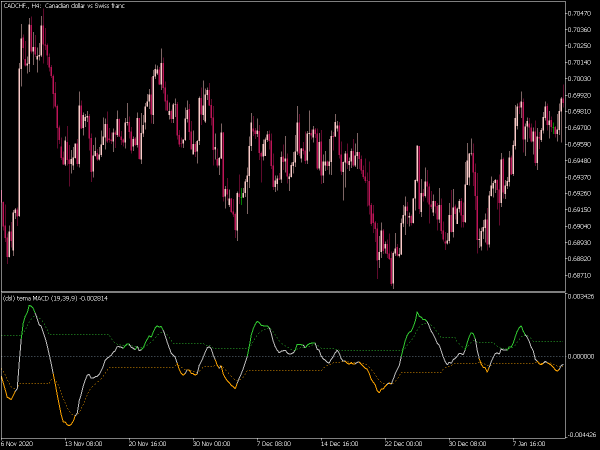
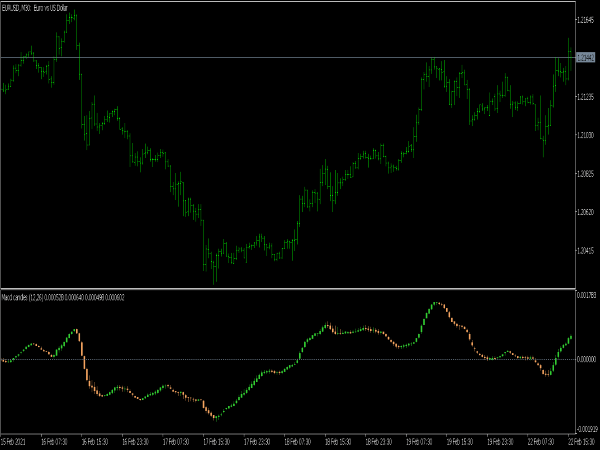
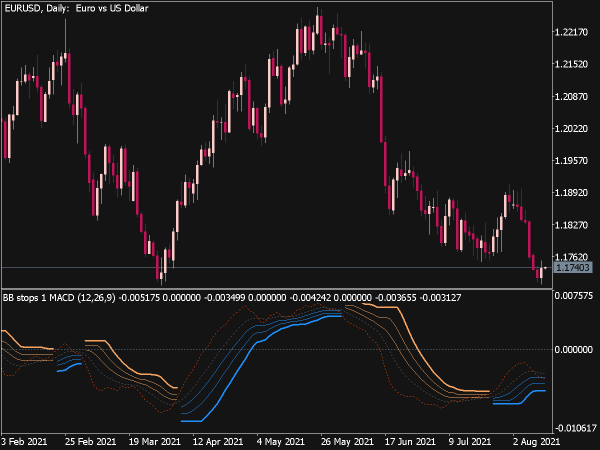
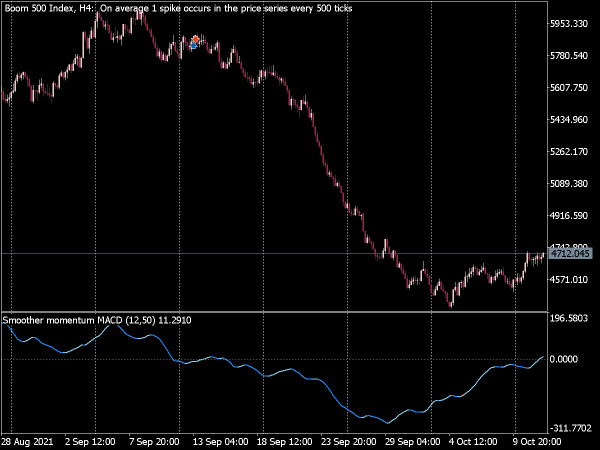
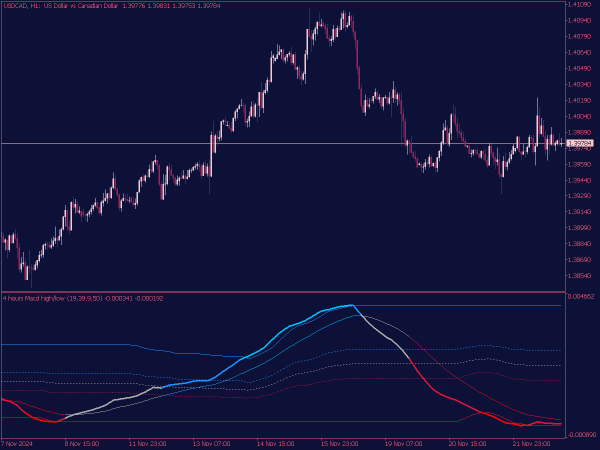
The MACD MTF (Multi-Time Frame) Indicator is a technical analysis tool that combines the Moving Average Convergence Divergence (MACD) with multiple time frames to provide a more comprehensive view of market trends and potential trading signals. By analyzing MACD signals across different time frames, traders can identify strong trends, potential reversals, or entry and exit points more effectively.
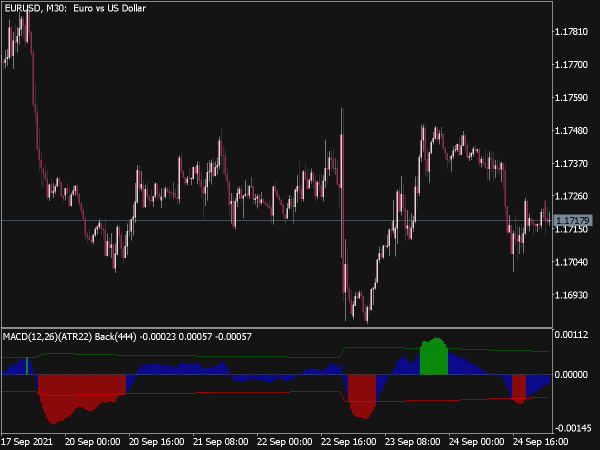
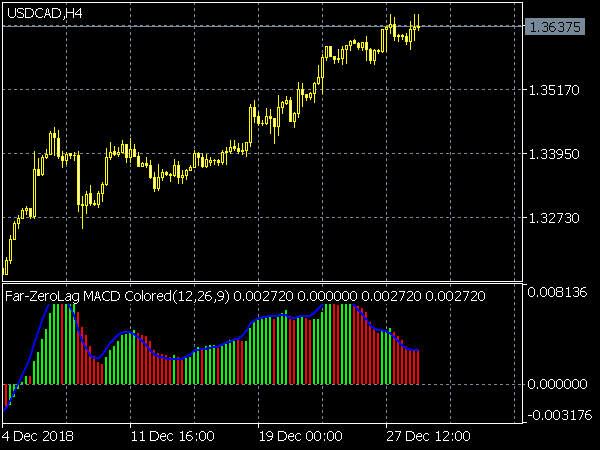
The MACD, which is comprised of the MACD line, signal line, and histogram, helps indicate momentum, while the MTF aspect allows traders to align short-term trades with the broader market direction indicated by longer time frames, enhancing the overall accuracy of trading decisions.
Below are several trading strategies utilizing the MACD indicator:
1. MACD Crossover Strategy:
A common entry point using the MACD is waiting for these crossovers. For a buy signal, traders should look for the MACD line to cross the signal line from below, ideally when the histogram (the bar chart representing the difference between the MACD and signal lines) also begins to turn positive, indicating strengthening momentum. Conversely, for sell signals, look for the MACD line to cross below the signal line with a decreasing histogram.
Tip: Confirm MACD signals with volume analysis. A significant increase in volume during a crossover can indicate a stronger move.
2. Divergence Strategy:
Another valuable method is using divergence between MACD and price movement. Bullish divergence occurs when the price makes lower lows while the MACD makes higher lows, suggesting that the downward momentum is weakening, indicating a potential buy point. On the flip side, bearish divergence appears when the price makes higher highs and the MACD makes lower highs, signaling a possible sell point as the upward momentum wanes.
Tip: Always check for convergence with other indicators or support/resistance levels for confirmation before entering a trade.
3. MACD Histogram Strategy:
The histogram provides insight into the strength of the momentum shift. A rising histogram indicates increasing bullish momentum, while a falling histogram points to bearish momentum. Traders can look for entry points when the histogram begins to expand after previously contracting, signaling a change in momentum direction.
Tip: Be mindful of the histogram's position relative to the zero line. A histogram above zero suggests a bullish trend, while below suggests bearish sentiment.
4. Trend Confirmation:
To enhance MACD's effectiveness, traders should consider the broader market trend to avoid false signals. If the overall market is in an uptrend (higher highs and higher lows), bullish MACD signals (crossovers, bullish divergence) can be viewed more favorably. Conversely, in a downtrend, bearish MACD signals should be more heavily weighted.
Tip: Use other trend-following indicators, like the Average Directional Index (ADX), to measure the strength of the trend alongside MACD.
5. Timeframe Consideration:
MACD can be applied across various timeframes, from day trading with 1-minute charts to longer-term investing with daily or weekly charts. For intraday traders, a shorter macd setting (such as 5-13-5) can yield more responsive signals, while longer timeframes (like 12-26-9) tend to smooth out noise for more reliable signals.
Tip: Always backtest your strategies over multiple timeframes to find which settings align best with your trading style and market characteristics.
6. Stop Loss and Take Profit Placement:
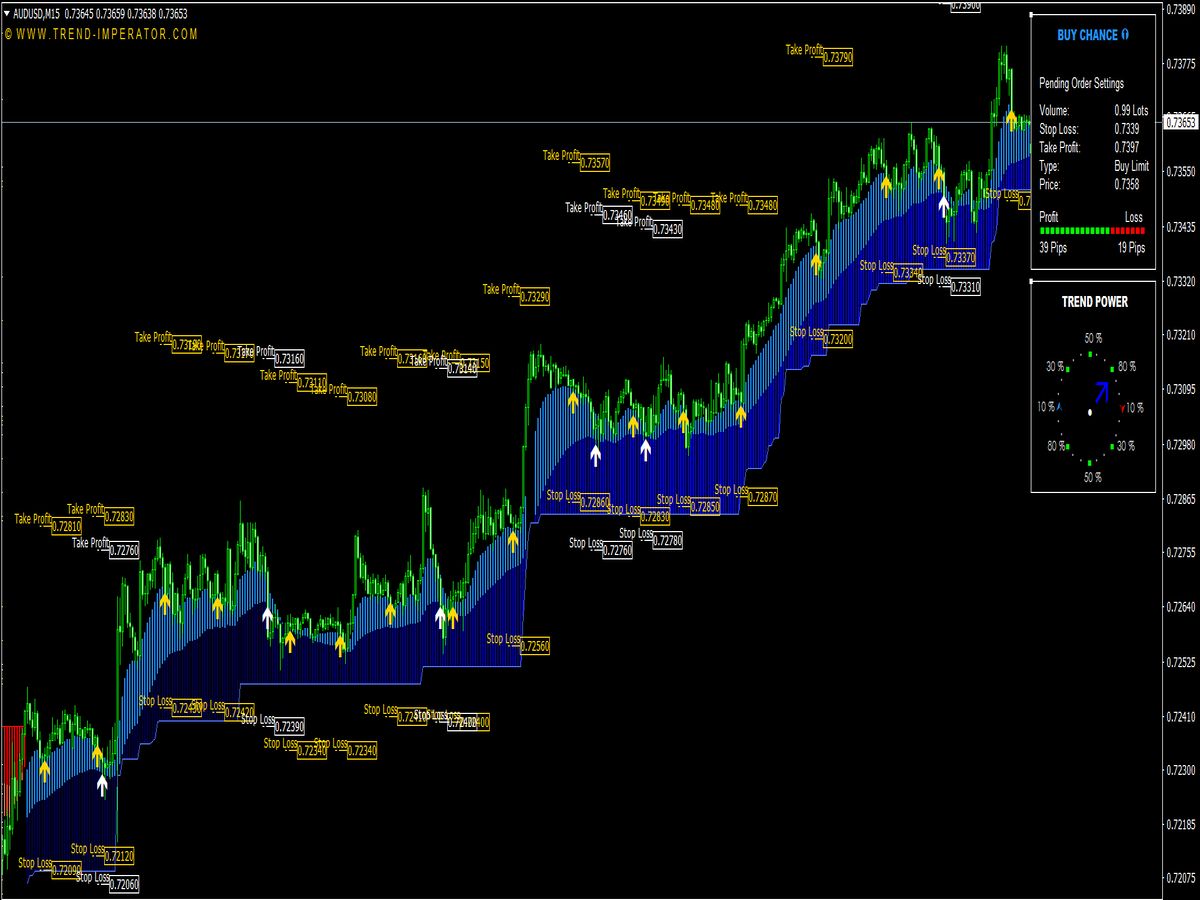
Incorporating stop loss and take profit levels is essential for risk management. A good rule of thumb is to place stop losses just outside resistance or support levels, depending on the direction of the trade. For take-profit orders, consider using a risk-reward ratio of at least 1:2, ensuring that potential gains outweigh projected losses.
Tip: Continuously adjust trailing stop losses as the trade moves favorably, which helps secure profits while allowing for further upside potential.
Final Consideration:
While MACD is a valuable tool, incorporating it into a comprehensive trading strategy is crucial. Use additional confirmations through other indicators or price patterns to filter out false signals and improve the accuracy of entries. A disciplined approach to entry and exit strategies, combined with robust risk management practices, will enhance the effectiveness of MACD in identifying profitable trading opportunities.
In conclusion, MACD can significantly aid traders in discerning entry points and exit strategies. By employing strategies like crossovers, divergences, and histogram analysis, while taking broader market trends and timeframes into account, traders can optimize their use of this powerful momentum indicator to navigate the complexities of the financial markets effectively.

