Submit your review | |
The MACD (Moving Average Convergence Divergence) is a popular momentum indicator in forex and stock trading that helps identify potential buy and sell signals through crossovers. To effectively use a MACD Crossover Indicator with arrows in MetaTrader 4 (MT4), follow these guidelines.
Understanding MACD
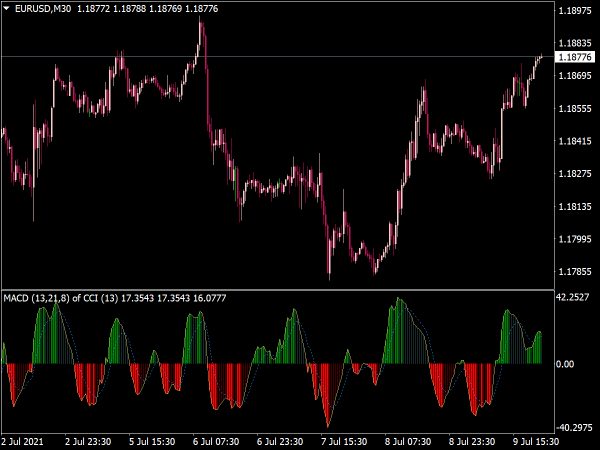
The MACD consists of two lines: the MACD line (the difference between the 12-day and 26-day exponential moving averages) and the signal line (a 9-day EMA of the MACD line). A histogram may also be included, showing the difference between these two lines visually.
Setting Up MACD in MT4
1. Adding MACD to Your Chart: Open MT4, choose your desired chart, and go to "Insert" > "Indicators" > "macd-crossover-signal-indicator". The default settings (12, 26, 9) are effective for many traders.
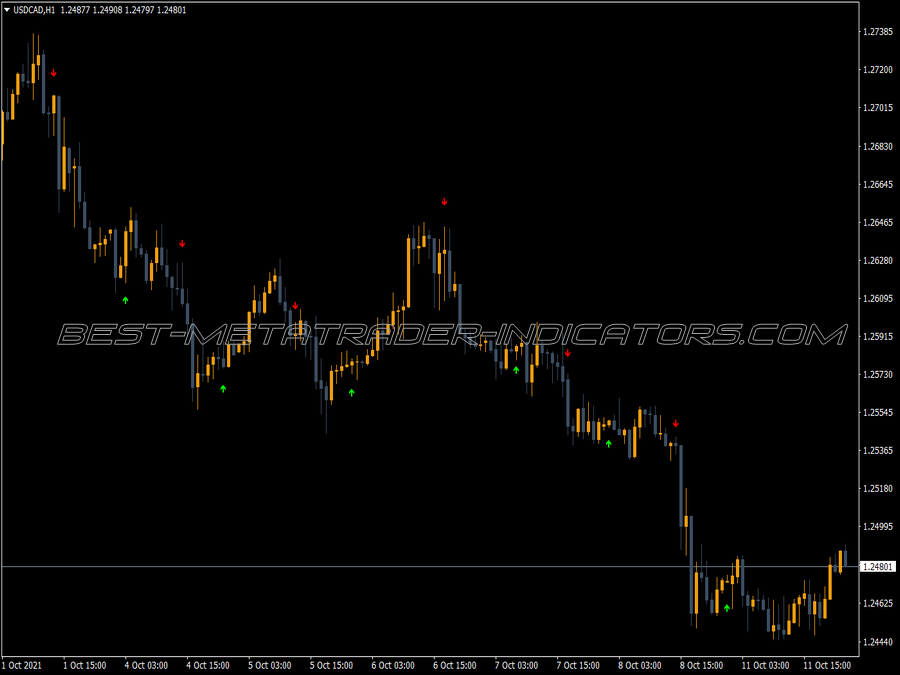
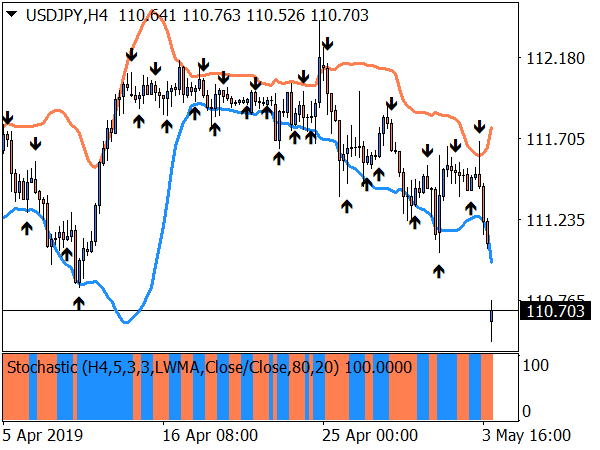
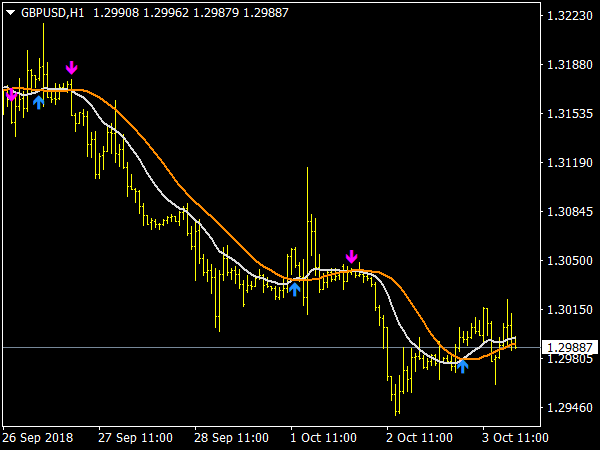
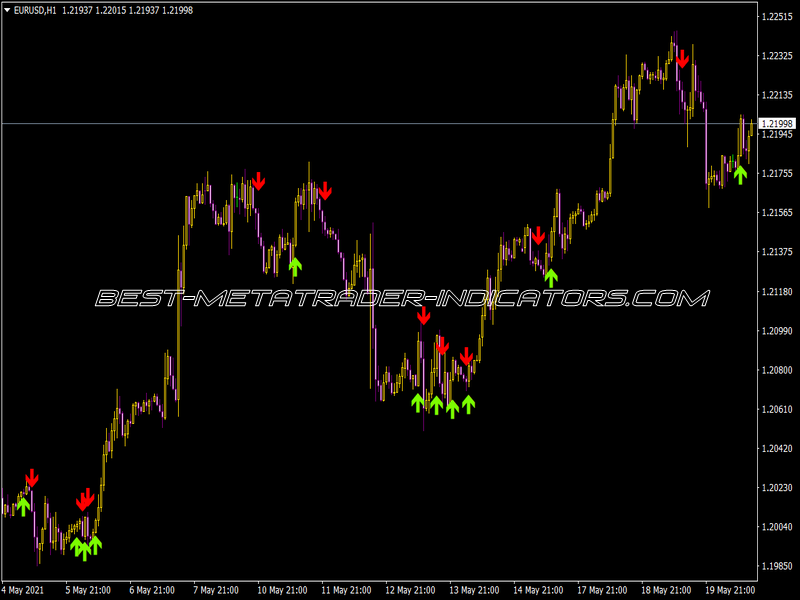
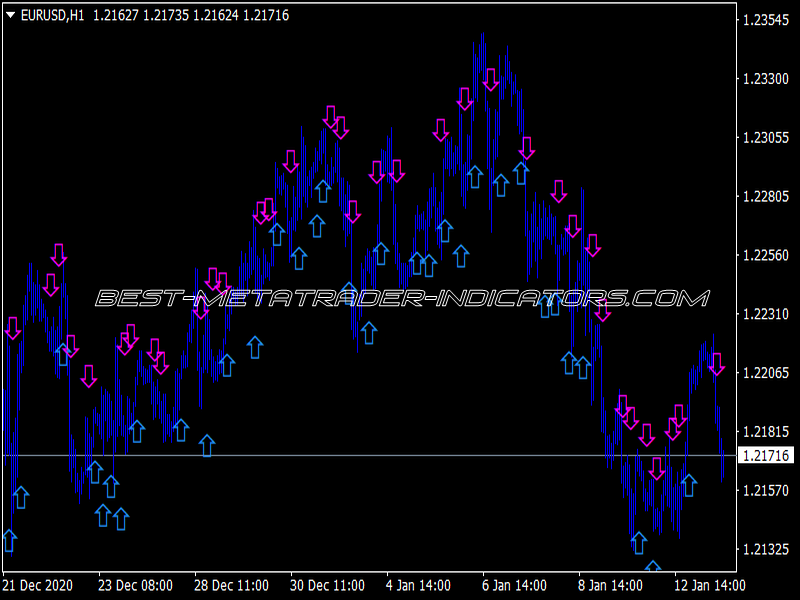
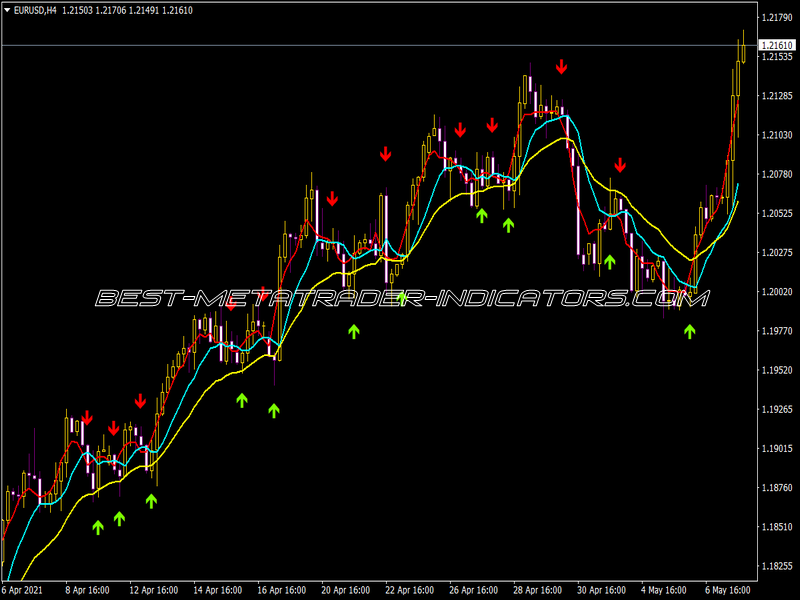
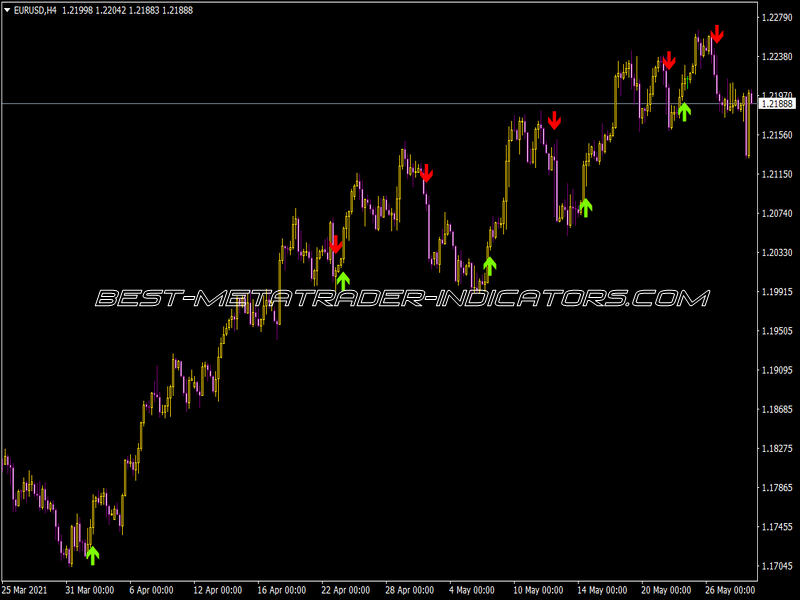
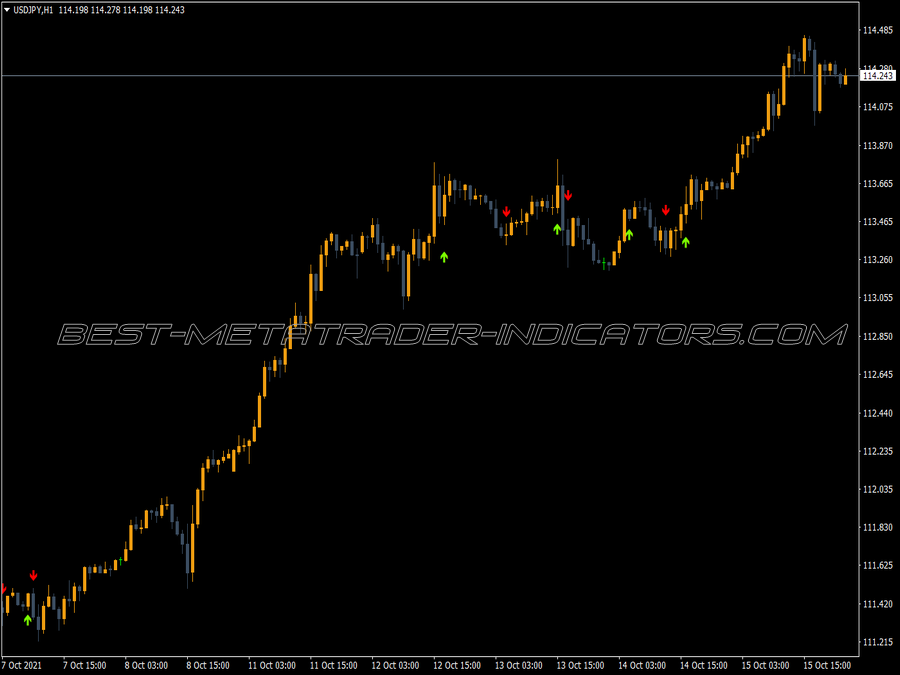
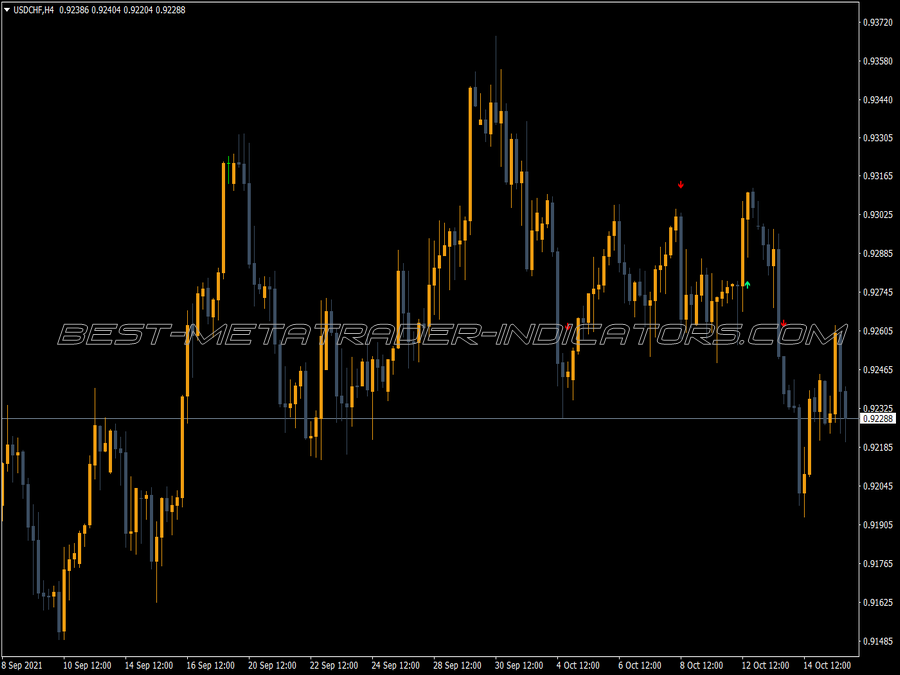
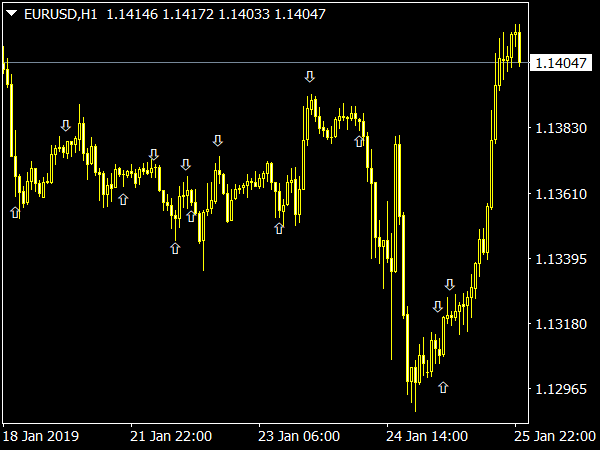
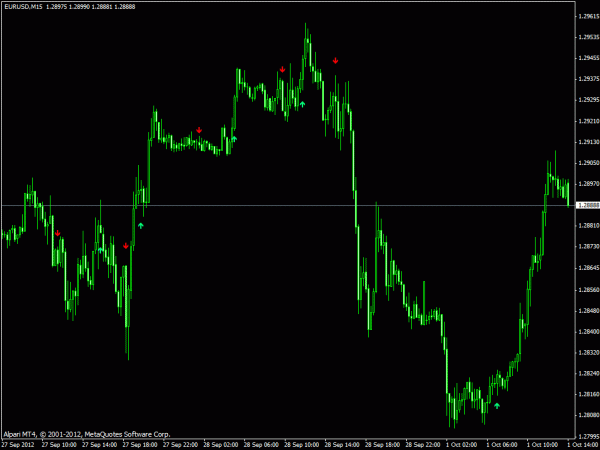
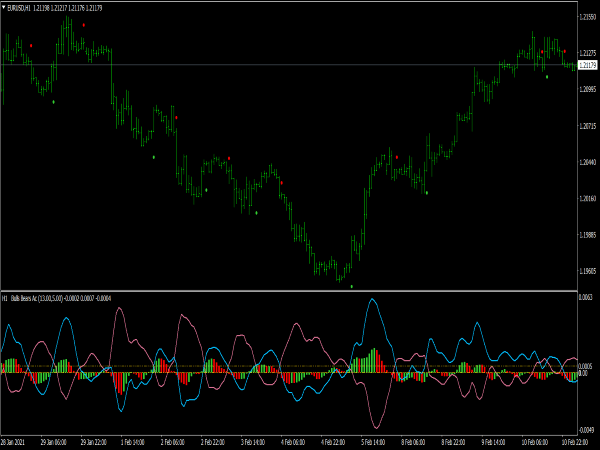
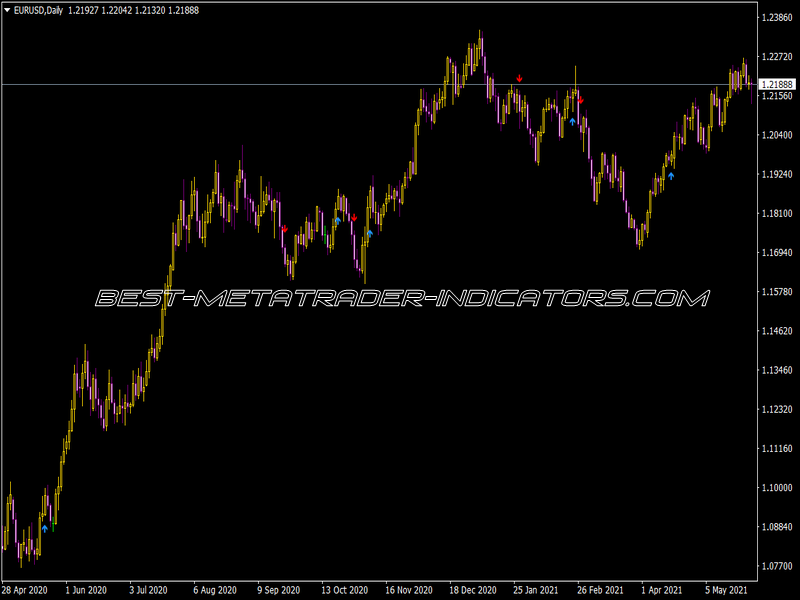
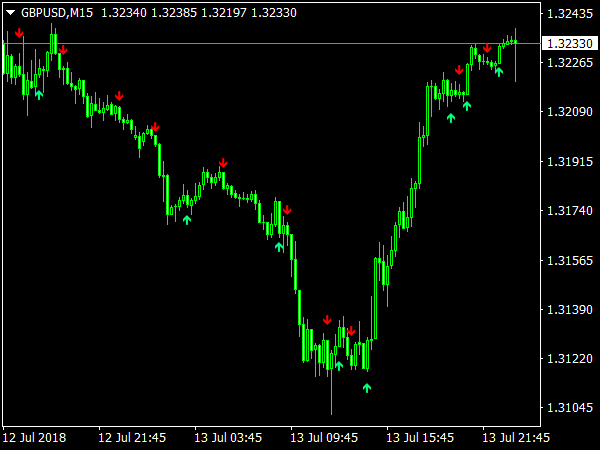
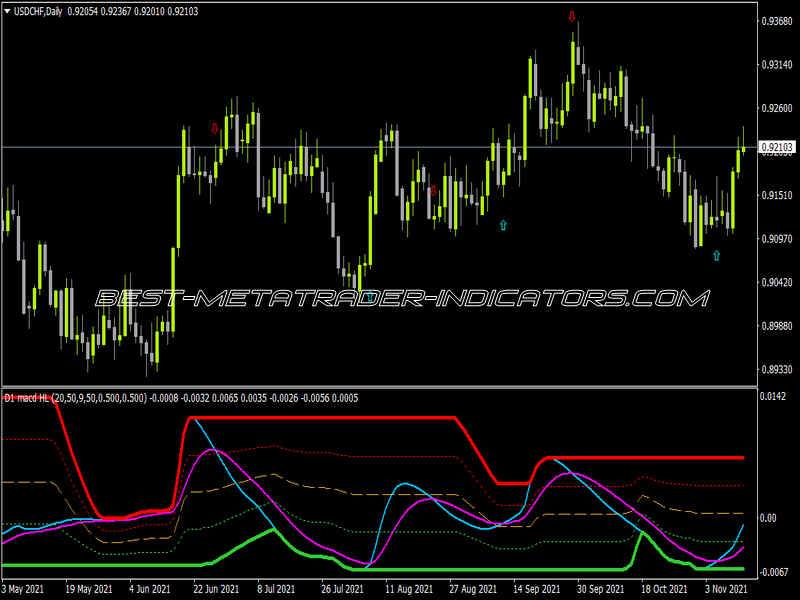
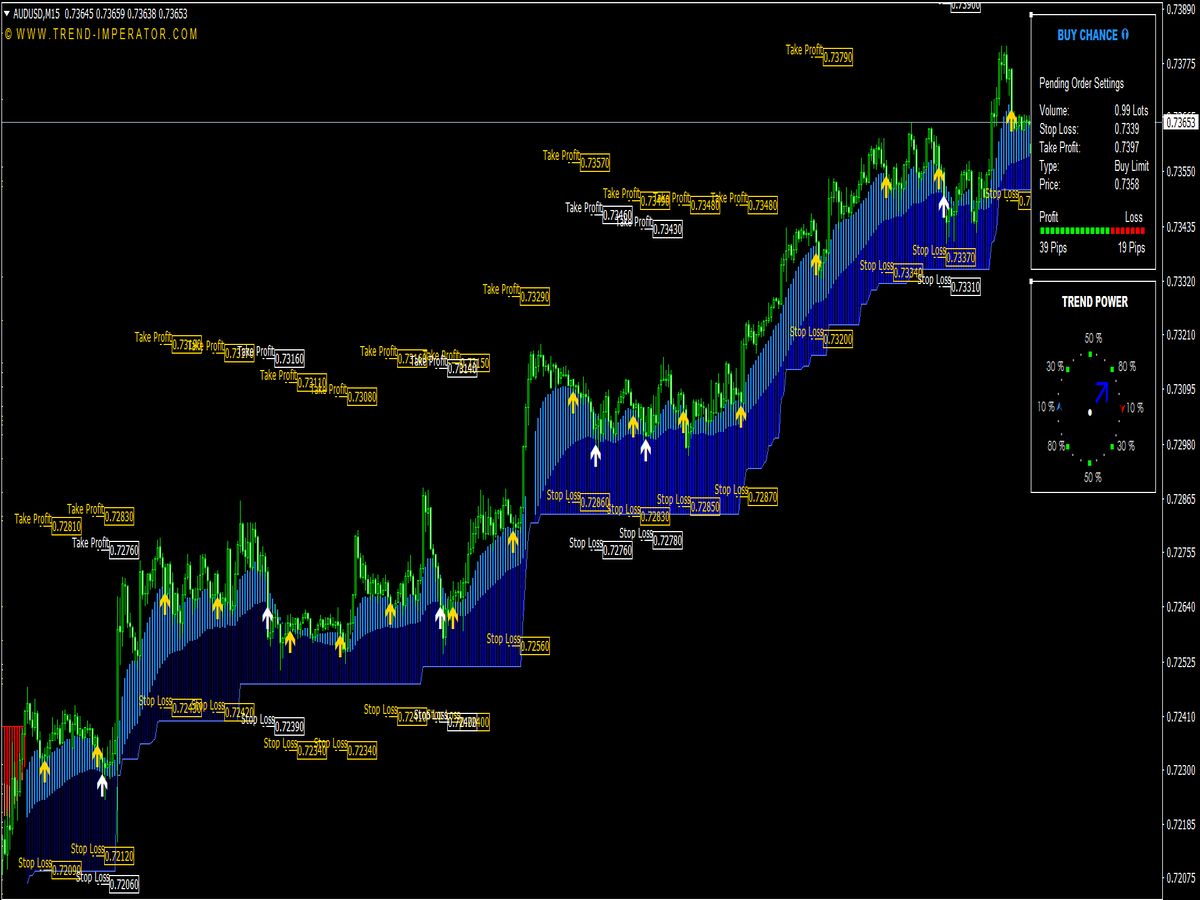
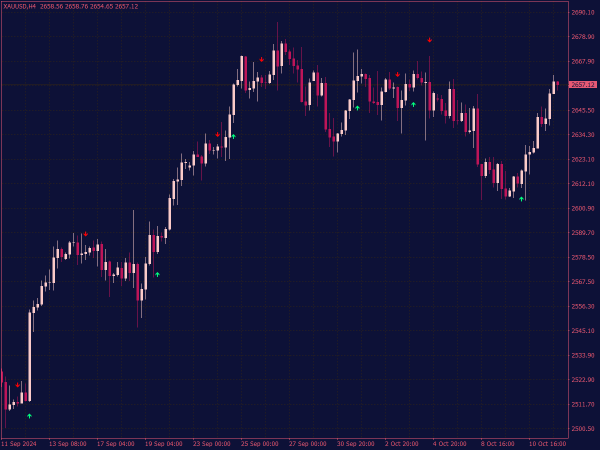
2. Customizing with Arrows: For visual effectiveness, consider adding custom scripts or indicators that display arrows when a crossover occurs. You can find various MACD arrow indicators online or create your own using coding in MQL4.
Trading Strategy with MACD Crossover
1. Identifying Buy Signals:
• A buy signal is generated when the MACD line crosses above the signal line (bullish crossover).
• Look for confirmation from the histogram turning positive or increasing in size.
2. Identifying Sell Signals:
• A sell signal occurs when the MACD line crosses below the signal line (bearish crossover).
• Similar to buy signals, confirm with the histogram turning negative.
3. Timeframe Selection: MACD can be applied to any timeframe, but for clearer signals, consider using daily or 4-hour charts.
Trading Tips
1. Confirmation: Always look for additional confirmation, such as price action, support and resistance levels, or other indicators (like RSI or stochastic) to ensure the reliability of your signals.
2. Risk Management: Use stop losses to manage risk effectively. A common approach is to place a stop loss just below the most recent swing low for a buy trade or above the swing high for a sell trade.
3. Avoiding False Signals: During sideways or choppy market conditions, MACD crossovers can yield false signals. To mitigate this risk, wait for a clear trend to form before acting on crossovers.
4. Check Divergence: Divergence between price and MACD can indicate potential reversals. For example, if prices are making new highs while MACD fails to do so, it could signal weakening momentum.
5. Take Profit Strategy: Establish clear target levels using previous highs/lows, or consider a risk-reward ratio of at least 1:2 to ensure that potential gains outweigh potential losses.
Conclusion
The MACD Crossover Indicator with arrows is a powerful tool for traders looking to capitalize on momentum and trend changes in the markets. By understanding how to use the MACD effectively, along with incorporating additional confirmations and sound risk management practices, you can enhance your trading strategy significantly. Always remember that no indicator is foolproof; continuous learning and adaptation to market conditions is key to long-term success in trading.
