Submit your review | |
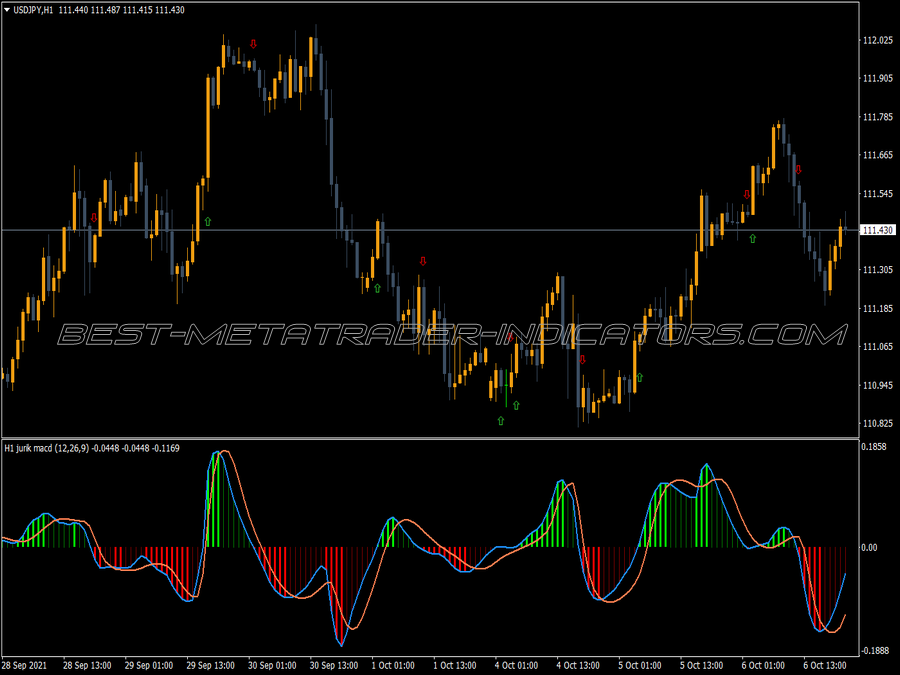
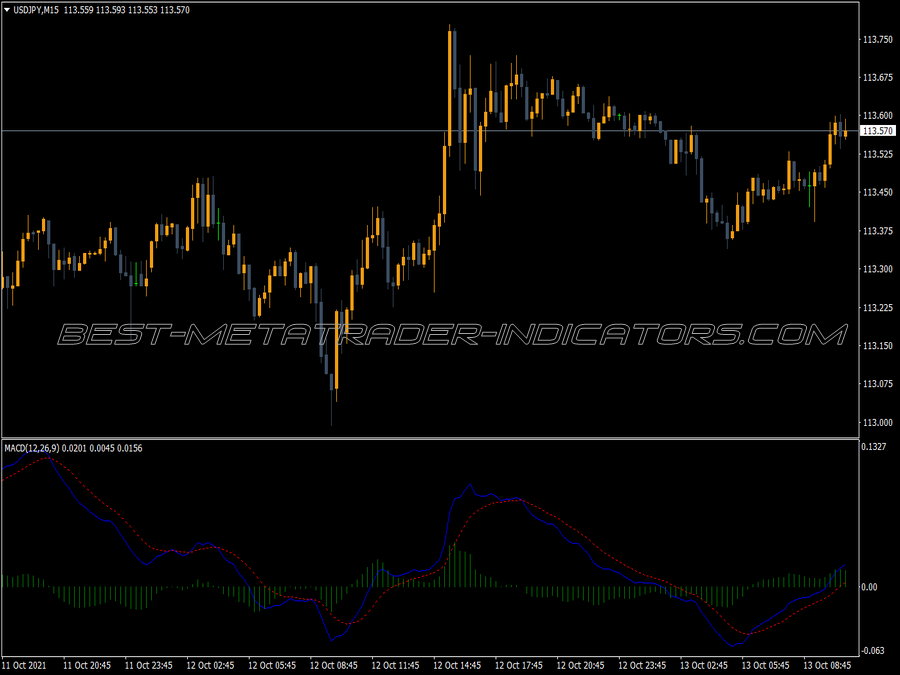
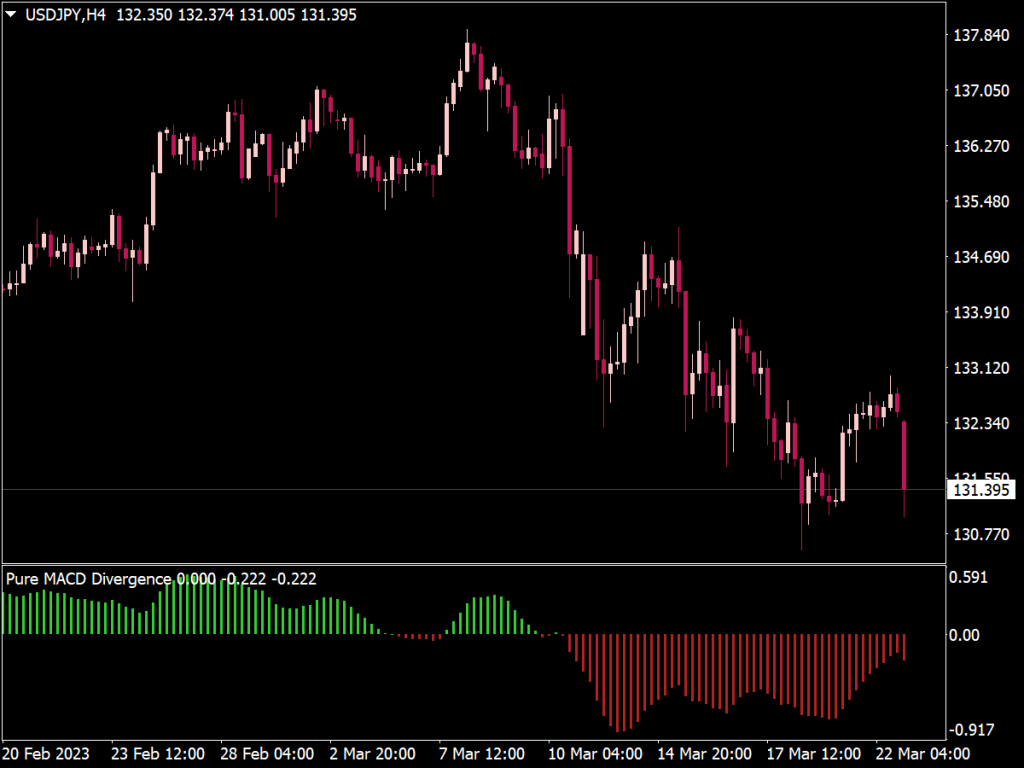
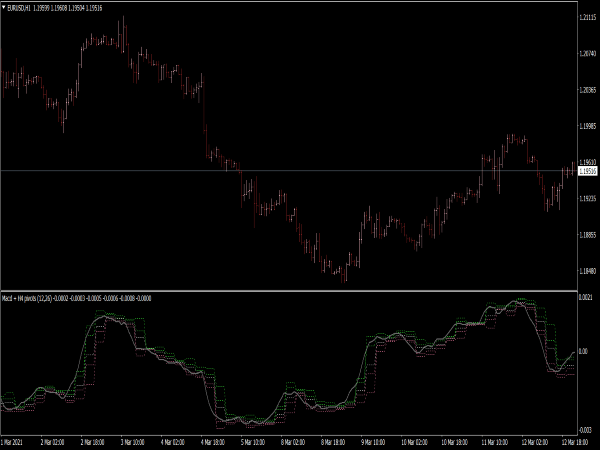
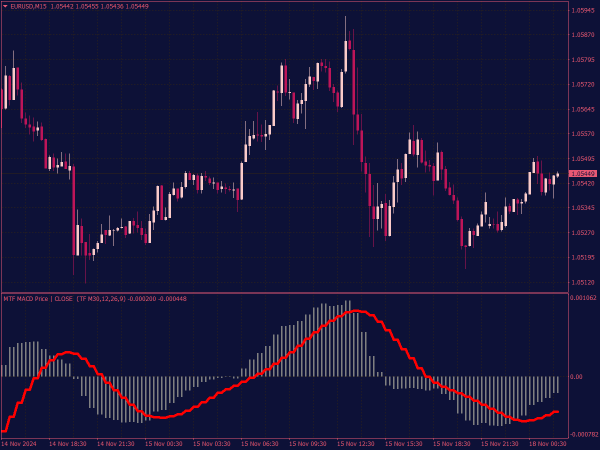
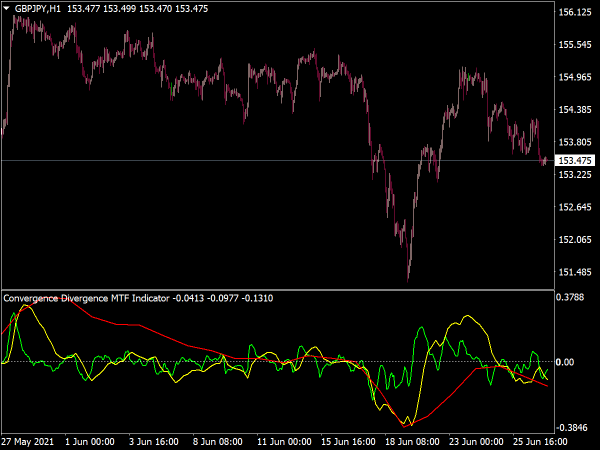
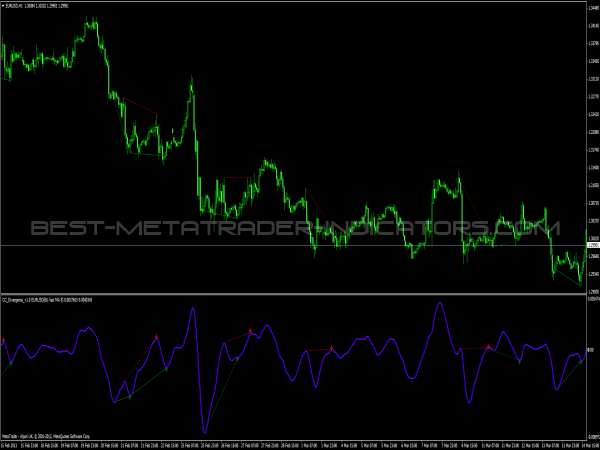
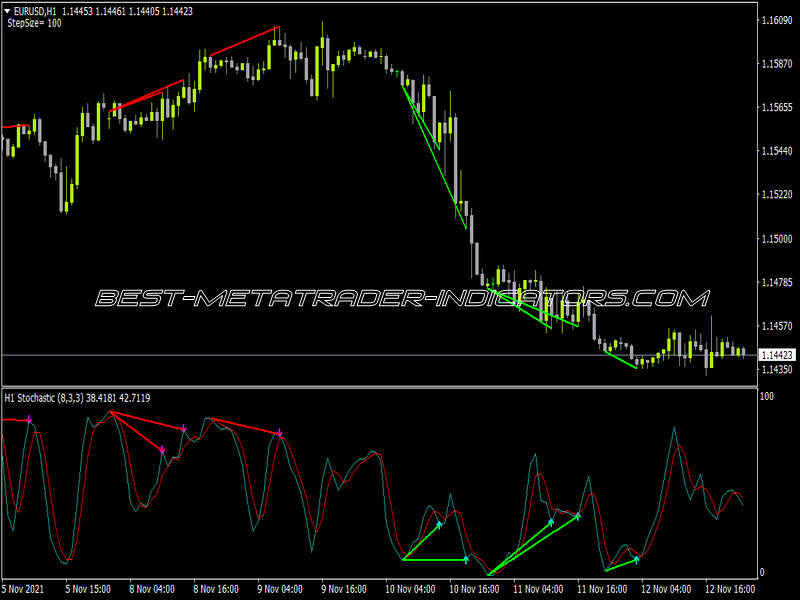
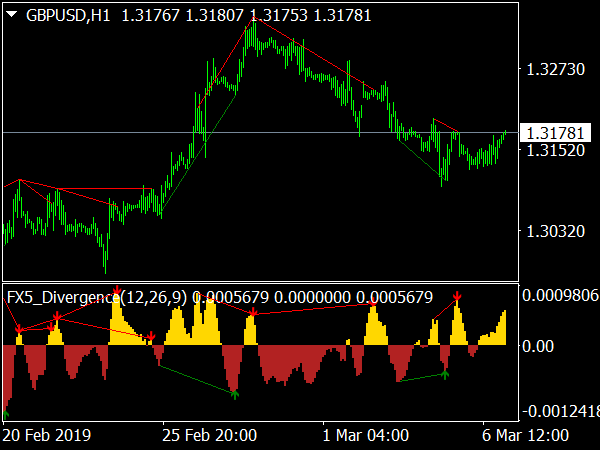
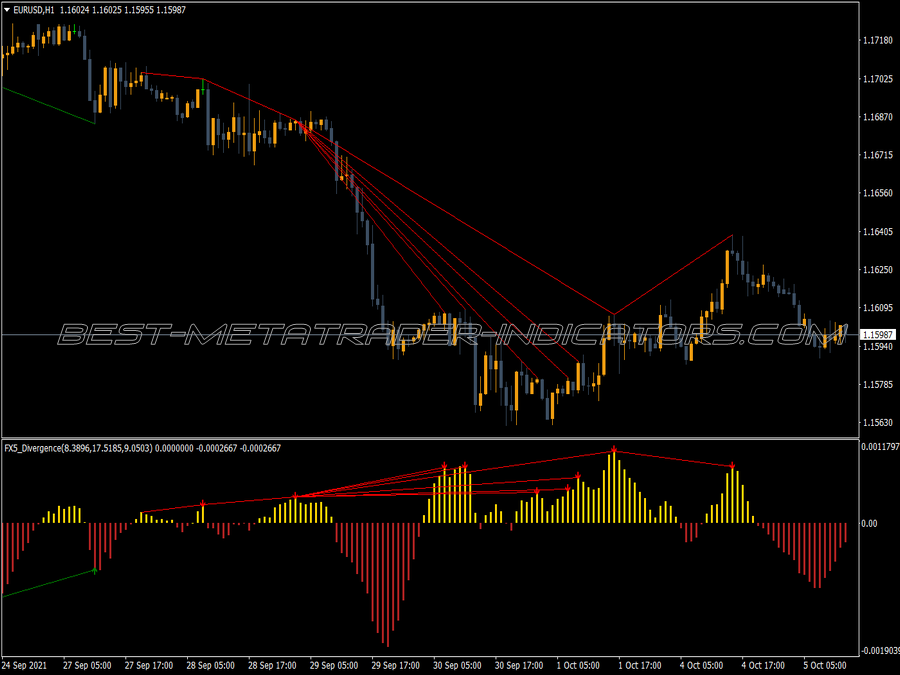
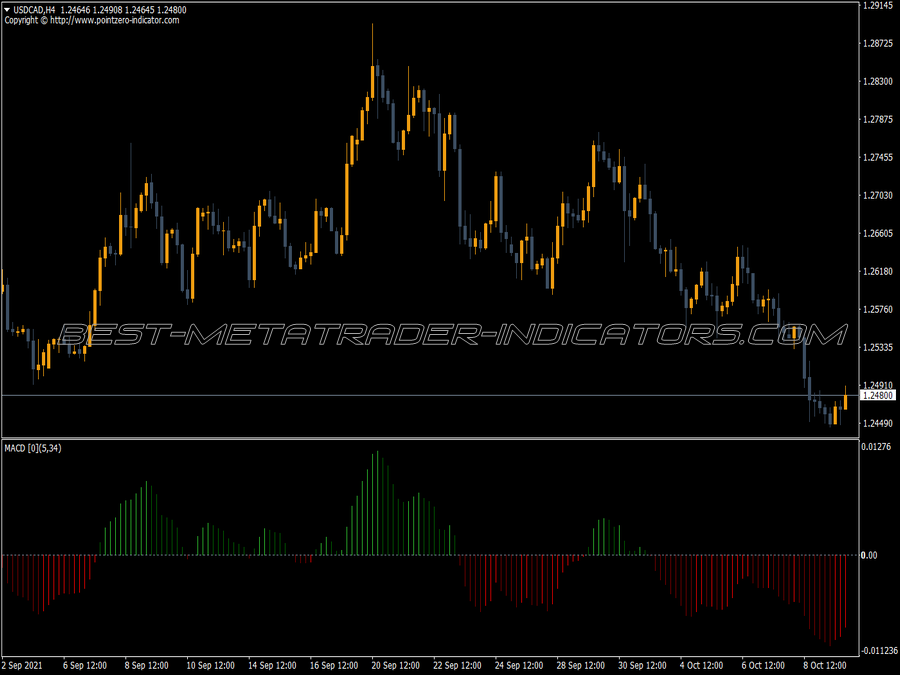
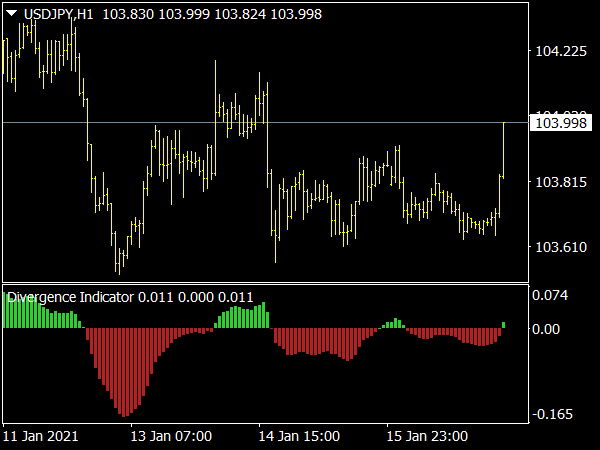
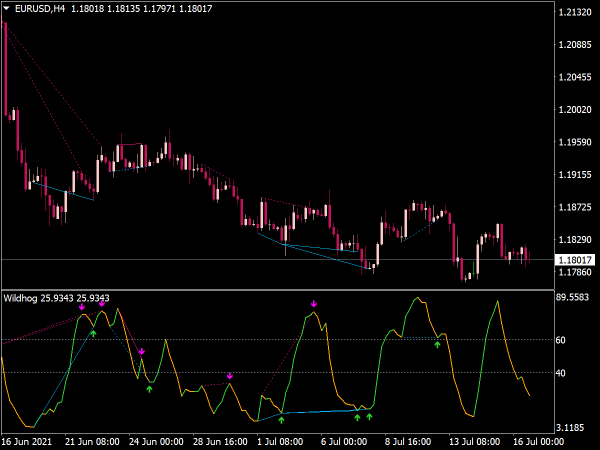
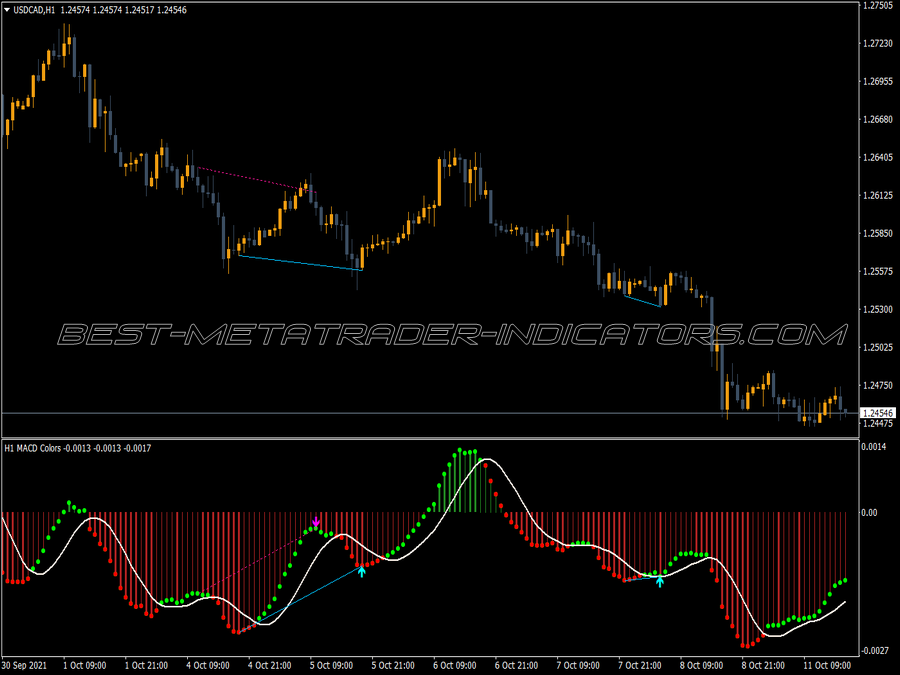
The MACD Divergence MTF (Multi-Time Frame) Indicator with Alerts is a technical analysis tool used by traders to identify potential reversals in market trends by analyzing the divergence between the MACD line and the price action across multiple time frames.
This indicator typically highlights bullish and bearish divergences, signaling potential entry and exit points. Alerts can be set up to notify traders when these divergences occur, allowing for timely decision-making. By integrating MTF analysis, traders can gain a broader perspective on market movements and enhance their trading strategies.
Divergence can be classified into two types:
1. Bullish Divergence: This occurs when the price forms lower lows while the MACD forms higher lows, suggesting a potential reversal from a downtrend to an uptrend.
2. Bearish Divergence: This happens when the price creates higher highs while the MACD establishes lower highs, indicating a possible reversal from an uptrend to a downtrend.
Recognizing these divergences can provide early signals of market reversals, making MACD divergence a valuable addition to a trader's toolkit.
1. Simple Divergence Strategy
The simplest strategy using MACD divergence involves observing the occurrences of divergence between price and the MACD. Here are the steps:
• Identify Divergence: Look for bullish or bearish divergence on the price chart in conjunction with the MACD. For instance, if you note that prices are decreasing but the MACD shows increasing momentum, this is a bullish divergence.
• Entry Point: Once divergence is observed, wait for confirmation. A common confirmation signal is a bullish candlestick pattern forming after a bullish divergence and vice versa for bearish divergence.
• Set Stop Loss: Position your stop loss below the recent swing low (for a bullish entry) or above the recent swing high (for a bearish entry).
• Take Profit: Set a take-profit target based on a risk-to-reward ratio, commonly 1:2 or 1:3, or utilize previous support and resistance levels for exits.
Divergence with Trend Confirmation
Combining MACD divergence with trend indicators allows traders to filter out false signals. Here’s a strategy:
• Identify the Trend: Use a longer-term moving average (like the 50-day or 200-day) to ascertain the overall trend. Trade only in the direction of the trend.
• Look for Divergence: When the trend is bullish, focus only on bullish divergences; conversely, look for bearish divergences in a downtrend.
• Confirm with MACD Crossovers: For stronger entries, wait for the MACD line to cross above the signal line following a bullish divergence or below for a bearish divergence.
• Manage Risk: As with the simple strategy, use stop-loss orders and set profit targets based on your established risk parameters.
Multi-Time Frame Divergence Strategy
Utilizing MACD divergence across multiple time frames can enhance the robustness of signals. Here’s how:
• Analyze Higher Time Frames: Start by assessing the daily or weekly chart for major trends and divergences.
• Drill Down to Lower Time Frames: Once a divergence is found on a higher time frame, switch to the hourly or 15-minute chart for entry points.
• Entry and Exit Criteria: Look for confirmation via candlestick patterns, volume, and possibly further MACD crossovers.
• Utilize the Divergence Strength: Ideally, the stronger the divergence on the higher time frame, the greater the likelihood of a reversal on the lower time frame.
4. Divergence with Other Indicators
Mixing the MACD's divergence signals with other technical indicators can limit false signals. Popular combinations include:
• Relative Strength Index (RSI): Similar to MACD, RSI can help confirm divergence. Look for both MACD and RSI to show divergence in the same direction for a stronger signal.
• Bollinger Bands: Use Bollinger Bands to find overbought or oversold conditions that could complement divergence signals. If price is at the upper band with bearish divergence, it could reinforce the likelihood of a price drop.
• Volume Indicators: Incorporate volume analysis to validate signals; a divergence signal with increasing volume can suggest a stronger move in the direction implied.
5. Managing Risk and Exit Strategies
Regardless of the strategy, risk management is critical for long-term success:
• Position Sizing: Always determine your risk tolerance and ensure position sizes align accordingly.
• Stop-Loss Placement: As a fundamental part of your strategy, effectively place stop losses to minimize losses.
• Use Trailing Stops: Implement trailing stops to lock in profits as the trade moves in your favor.
• Review and Adapt: Regularly review your trades and performance to adapt strategies based on outcomes and market changes.
Conclusion
MACD divergence is a powerful indicator that can enhance trading strategies significantly. By understanding the various forms of divergence and applying effective trading strategies, traders can make more informed decisions. Whether through simple divergence observations, filter confirmation with trend indicators, or multi-time frame analysis, the possibilities are vast.
Ultimately, integrating MACD divergence with proper risk management and consistent review will significantly enhance a trader's chance for success in the financial markets.
