Submit your review | |
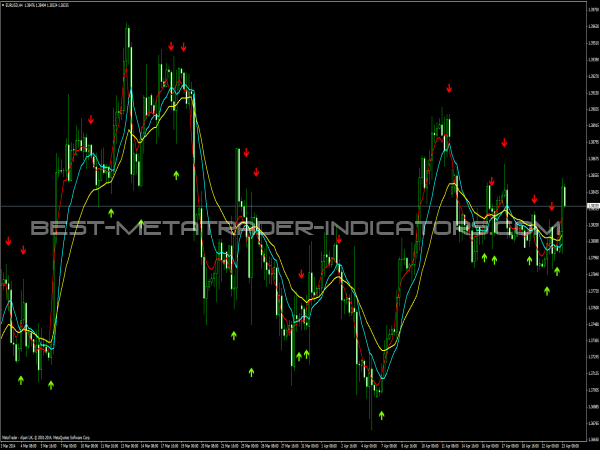
The MA systems have not been functioning since the 1980s. The numerous attempts to improve the MAs have not changed anything significant in this regard. It is still most sensible to simply take the MAs as an indication of the direction of the trend, e.g. oscillators show good results if you only use them in the direction of the respective MAs.
In day trading, it is not very useful to calculate the MA on the closing price of the respective bars in a shorter time frame. It makes more sense here to align it to the midpoint price of the respective bar. As resistance and support zones, they only work in a trend, at least as far as crossovers are concerned. This is especially true for day trading in the intraday sector. When working with cycles for MAs, Gann recommended not to use the closing courses, but the midpoints of the daily range.
Moving Averages as trend lines
In the early days of technical analysis, many MAs were well suited as resistance and support lines. In later years, MAs became so popular, as this is only occasionally the case. In any case, it can be said that in the short time frame of day trading, usually MAs of 5 and 8 bars give support to the prices, as long as the trend is intact. If the prices fall back to the MA of 13 bars, it usually indicates a sideways movement.
Crossovers
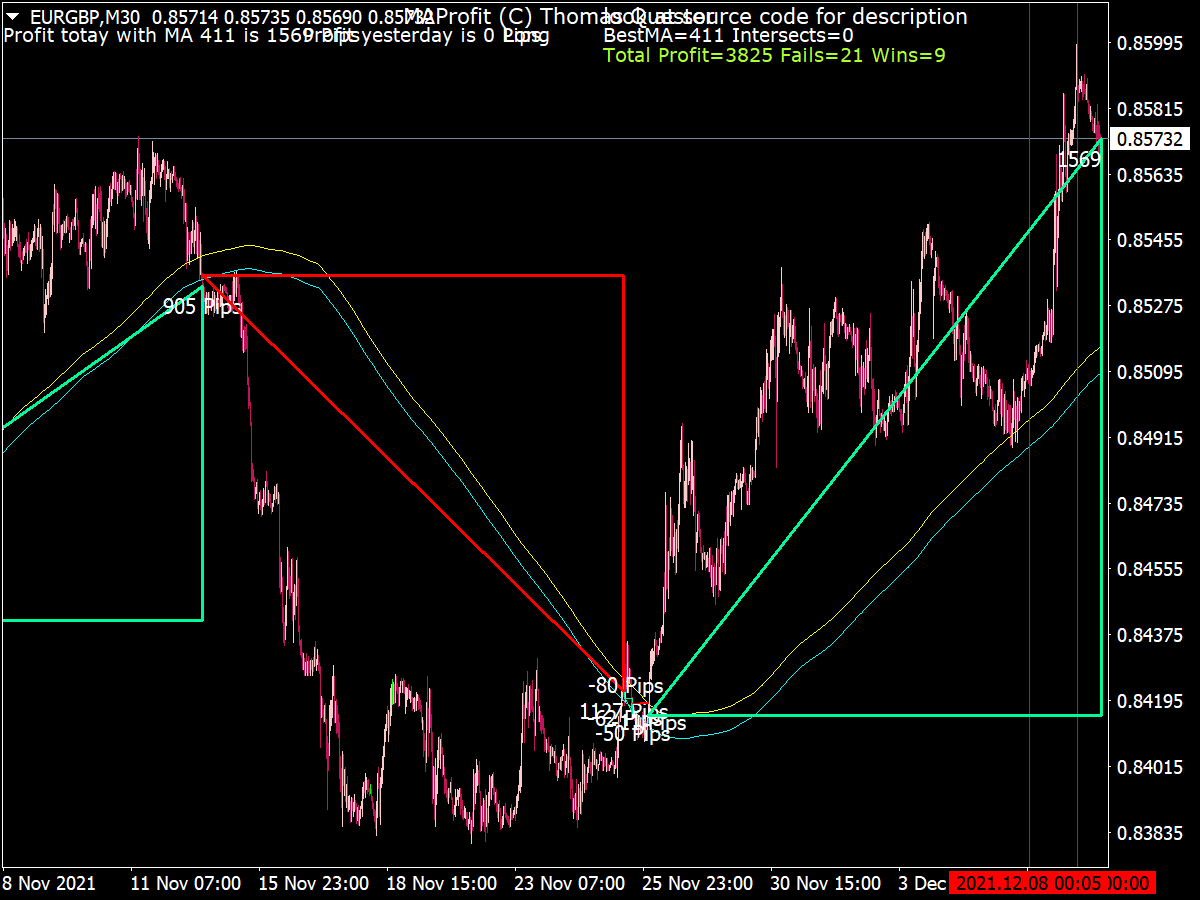
Of the classic indicators, the stochastic is quite suitable as a filter for crossover signals of the MAs, because it usually gives the right signals when the crossover signals are wrong. Crossovers can also be improved in the result if you mix different variants of the MAs with each other. By themselves, crossovers have a marksmanship that hardly ranks above chance. However, it can be improved quite considerably if, for example, crossovers are taken between a normal MA and a square or cubic MA. Regression analysis is used here.
Kiss of Death
The MAs very often form resistances and supports. It is called a kiss of goodbye (Kiss of Goodbye) when at the moment of touching the course and the MA, the course not only turns, but the MA is already running in the opposite direction, that is, in the direction in which the course then turns off. So, for example, if the prices fell and make a bottom on the MA, the MA should already rise at the moment of contact, etc.
The 200-day MA
This is an old stock market myth. The breaking of the 200-day MAs should be an important signal for stocks and the stock market, the turning point between bearish and bullish. However, this view is completely wrong, the 200-day MA is of no importance, as it is easy to see on any historical chart. Strangely enough, but the 200-MA works pretty well in the same sense for most markets on 15-minute charts, so an MA of 200 bars a 15 minutes.
Tip
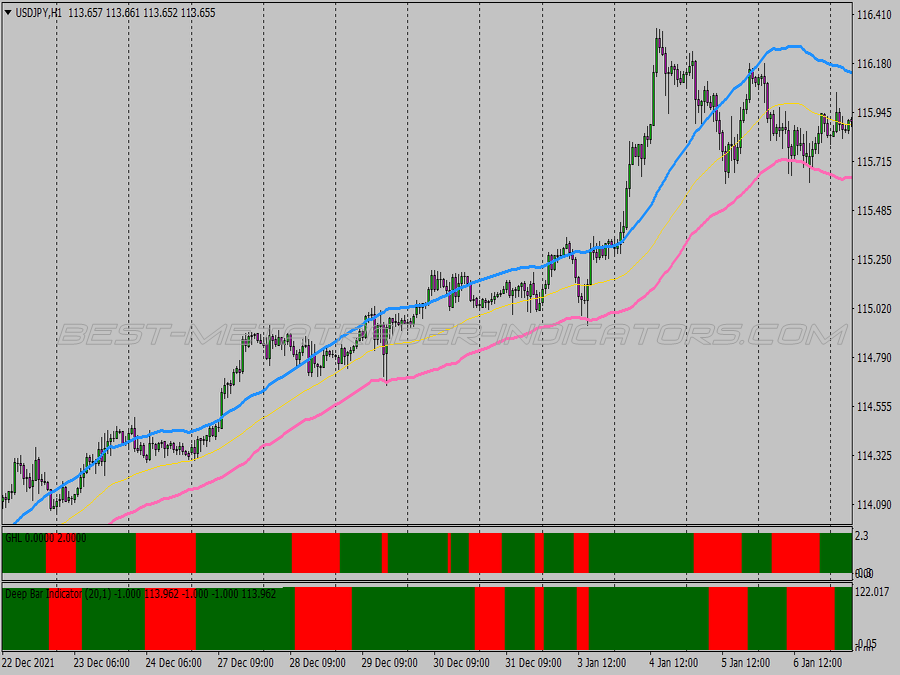
You can use the MA calculated on the lowest prices very well instead of trend lines. This MA is broken relatively rarely, and then only for a short time. At the last stage of a movement, it is almost never broken. So it also offers good resistance and support zones.
