Submit your review | |
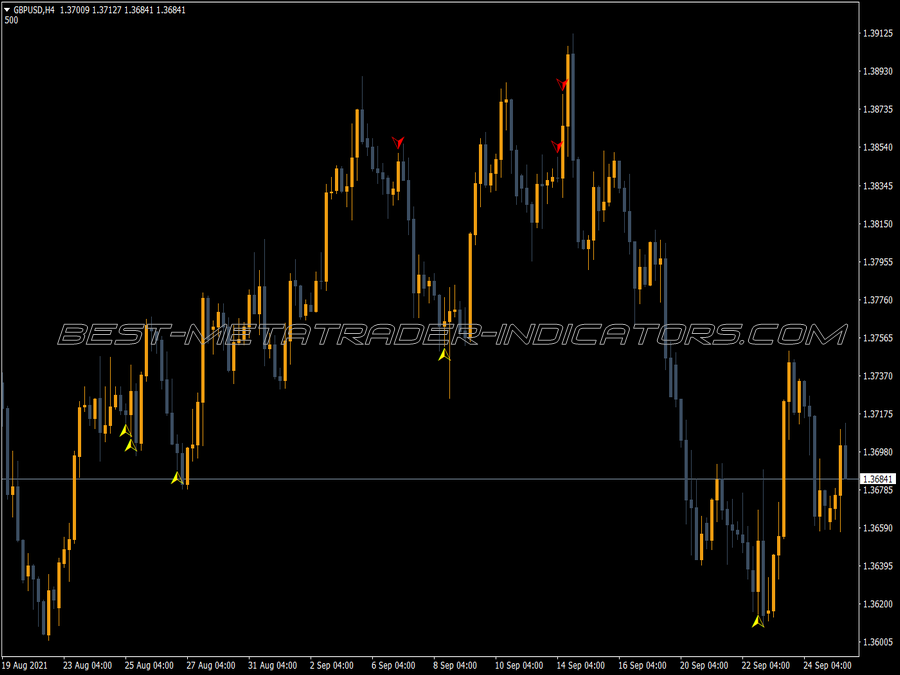
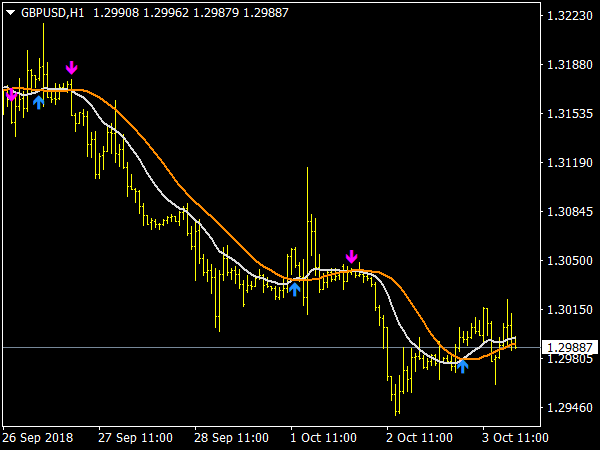
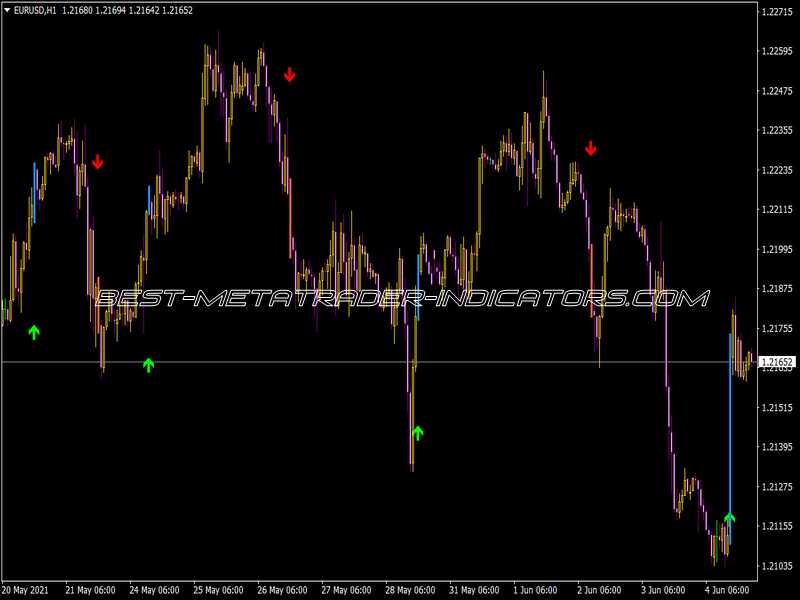
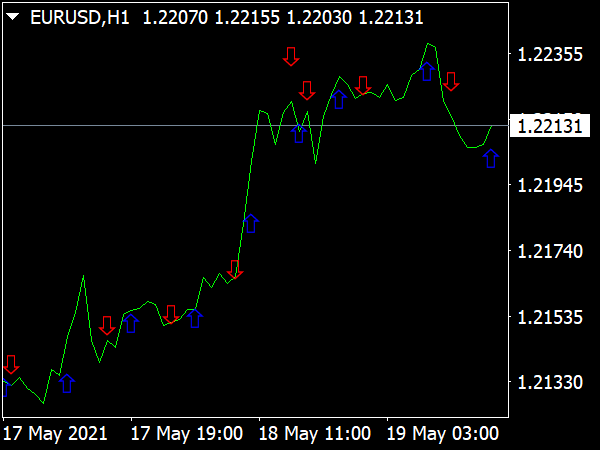
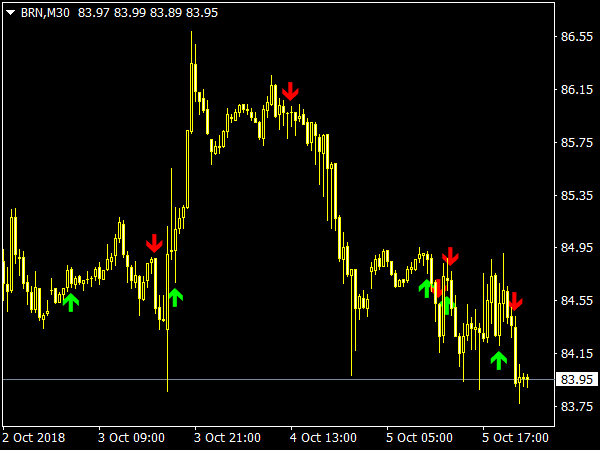
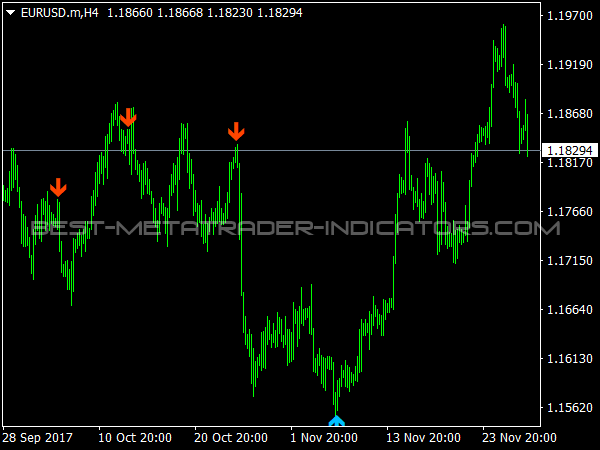
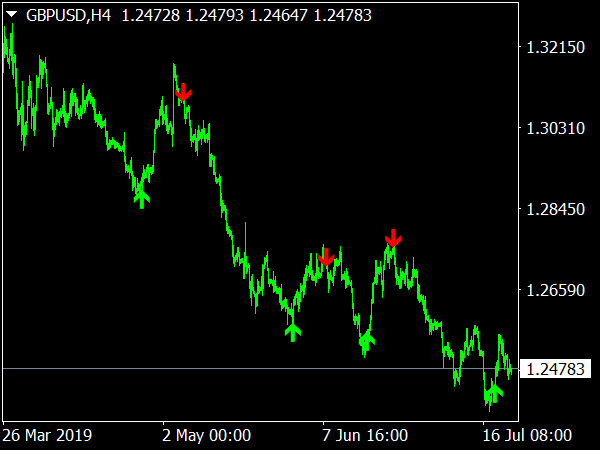
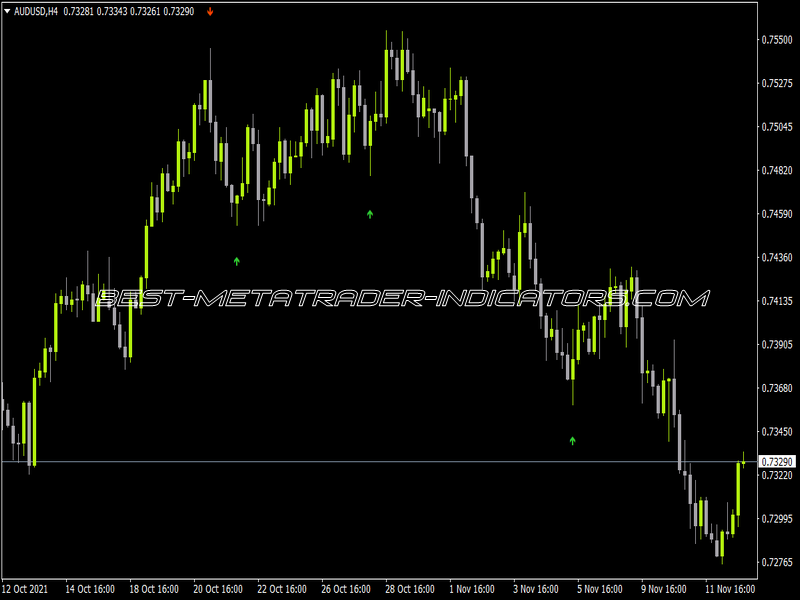
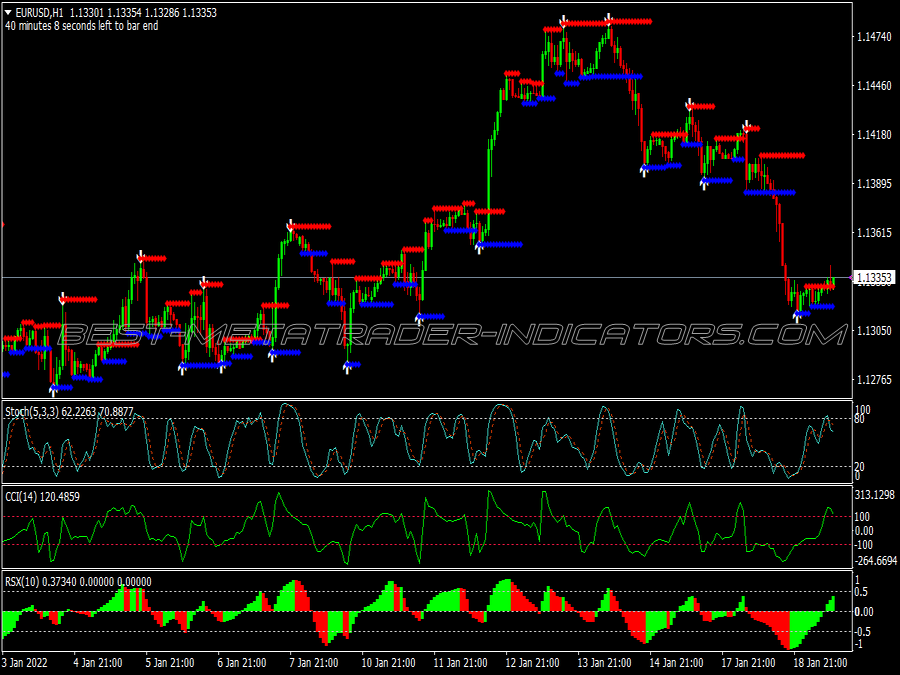
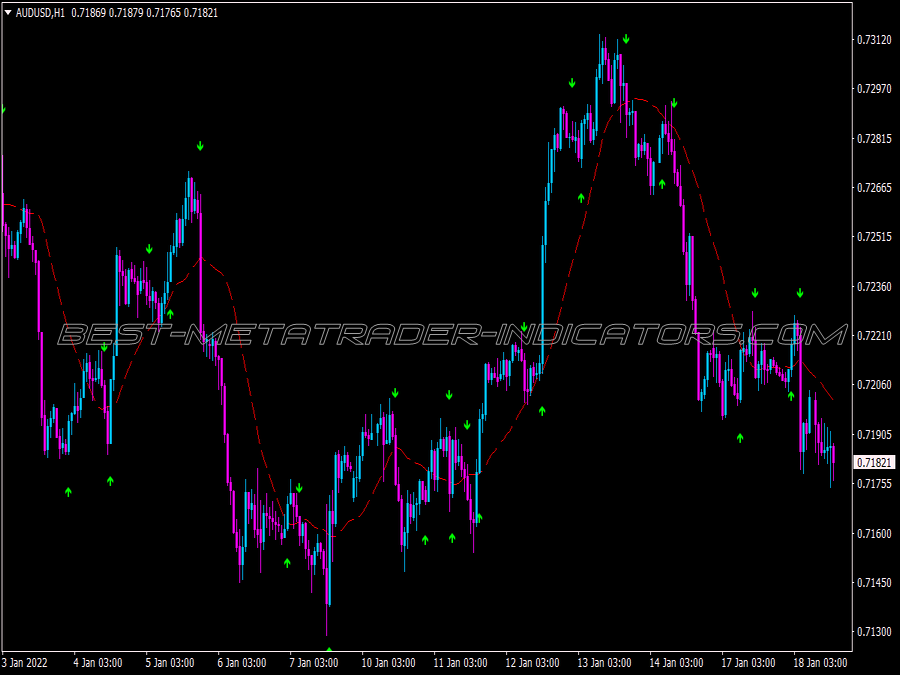
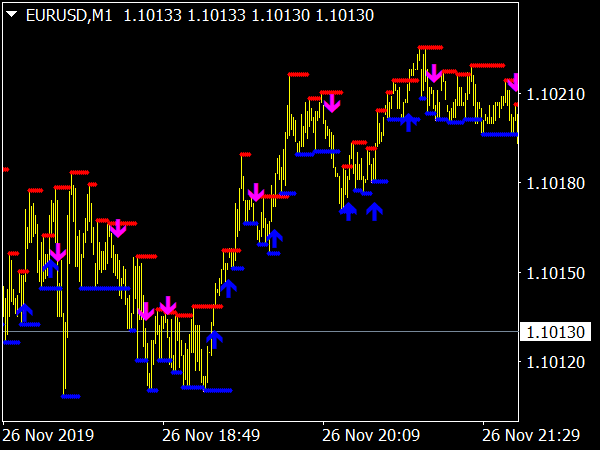
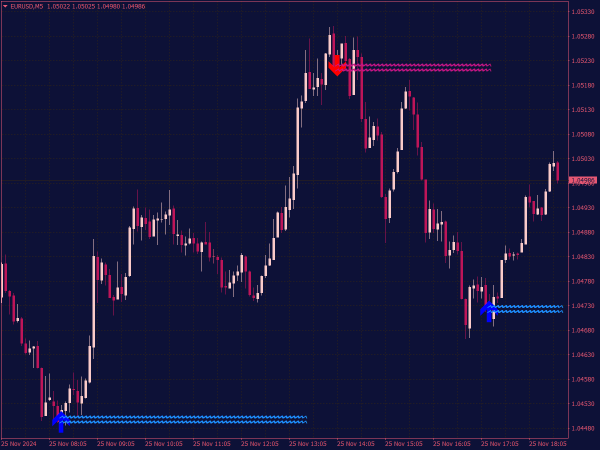
The Lucky Reversal Indicator with arrows is a trading tool used in technical analysis to identify potential reversal points in the market. It typically consists of visual arrows that appear on price charts to signal bullish or bearish reversals, helping traders make informed decisions about when to enter or exit trades.
By analyzing market patterns, trends, and price movements, this indicator aims to enhance the trading strategy by providing clear buy or sell signals. However, as with any trading tool, it's essential to use it in conjunction with other indicators and risk management practices for optimal results.
Reversal trading strategies aim to identify when the current trend in a financial market is about to change direction. This type of trading can be quite rewarding but comes with its own set of risks. Utilizing indicators can enhance your ability to spot potential reversals effectively. Below, we delve into several strategies incorporating technical indicators to assist traders in navigating market reversals.
1. Candlestick Patterns and Confirmation Indicators
Candlestick patterns like the hammer, shooting star, and engulfing patterns signal potential reversals. While these patterns can provide the initial indication of a reversal, it’s beneficial to use confirmation indicators such as the Relative Strength Index (RSI) or Moving Average Convergence Divergence (MACD).
Implementation
• Identify the Pattern: Look for candlestick patterns at key support or resistance levels. For example, a hammer at a support level could indicate a bullish reversal.
• Confirm with RSI: After spotting a reversal pattern, check the RSI. A reading below 30 may suggest that the asset is oversold, supporting a bullish reversal. Conversely, an RSI above 70 can confirm a bearish reversal for a shooting star or double top.
• Use MACD for Confirmation: Monitor MACD lines. A bullish crossover (the MACD line crossing above the signal line) can confirm a bullish reversal, while a bearish crossover can confirm a bearish reversal.
2. Divergence with RSI and MACD
Divergence occurs when the price moves in the opposite direction of an indicator. This is a potent signal of potential trend reversals.
Implementation
• Look for Divergences: Identify bullish divergence when the price creates lower lows, but the RSI or MACD makes higher lows. This indicates weakening downward momentum. Conversely, bearish divergence occurs when prices make higher highs while indicators create lower highs.
• Entry Points: Once divergence is identified, wait for further confirmation, such as a close above the previous high in the case of bullish divergence or a close below the previous low for bearish divergence.
• Set Stop-Loss Orders: Use previous swing highs or lows as stop-loss levels to minimize risk.
3. Fibonacci Retracement Levels
Fibonacci retracement levels are widely used to predict potential reversal points. Traders look for price action bouncing off these levels during corrections.
Implementation
• Identify the Trend: Determine the prevailing trend (uptrend or downtrend).
• Draw Fibonacci Levels: For an uptrend, draw the Fibonacci retracement from the swing low to the swing high. In a downtrend, do the opposite.
• Watch for Price Reactions: Observe how price interacts with the Fibonacci levels, especially the 38.2%, 50%, and 61.8% levels. If price rebounces sharply off these levels, it could indicate a potential reversal.
• Confirm with Indicators: Use additional indicators, like RSI or Stochastic Oscillator, to confirm momentum in the direction of the reversal.
4. Moving Average Crossovers
Moving averages smooth price data to identify trends. A crossover between different period moving averages can signal potential trend reversals.
Implementation
• Choose Your Averages: Common choices include the 50-day and 200-day moving averages. A short-term moving average crossing above a long-term moving average (known as a golden cross) typically signals a bullish reversal, while the opposite (death cross) indicates a bearish reversal.
• Confirm with RSI: After a crossover, check the RSI for confirmation. A bullish crossover combined with an RSI below 30, suggesting oversold conditions, could fortify the reversal signal.
• Entry and Exit Points: Enter trades based on confirmed signals and set stop-loss levels just below significant swing lows or highs.
5. Bollinger Bands® and Price Action
Bollinger Bands® are a volatility indicator consisting of a middle band (moving average) and two outer bands. Price touching or breaking the lower band can indicate potential bullish reversals, while touching the upper band may indicate bearish reversals.
Implementation
• Identify Trends: When price reaches the lower Bollinger Band, it suggests oversold conditions, creating potential for a bullish reversal. Conversely, an approach to the upper band may suggest a bearish reversal.
• Look for Price Patterns: Combine this with candlestick patterns. For instance, a bullish engulfing pattern at the lower band could signal a reversal.
• Momentum Confirmation: Use the RSI or MACD to confirm momentum before entering a trade. Look for bullish divergence when prices hit the lower band.
6. Trend Line Breaks and Volume Analysis
Breaks of trend lines can signal reversals. Analyzing volume alongside trend lines can add additional confirmation.
Implementation
• Draw Trend Lines: Identify significant trend lines in the market. A break of a trend line can indicate a potential reversal.
• Assess Volume: Look for high volume on the breakout to validate the potential reversal. High volume suggests strong interest and increases the likelihood that the trend has changed.
• Use Additional Confirmation: Couple this with indicators like RSI or MACD to further assess if the momentum supports the reversal.
Conclusion
Reversal trading can be a profitable strategy when executed with precision and a good understanding of technical indicators. By incorporating candlestick patterns, divergence, Fibonacci levels, moving averages, Bollinger Bands®, and trend lines with robust volume analysis, traders can enhance their ability to identify potential trend reversals.
Always remember to employ strict risk management and practice on demo accounts before applying these strategies in live trading to ensure a deep understanding of how they work in different market conditions. Happy trading!
Please add an alert to this indicator, its doing ok.
Are you guys going to make this reversal indicator for MT5 soon? I’ll even pay.
Please can you make a Lucky Reversal indicator for MT5 with pop alert. Thank u!!!
Very good indicator. Could you add an alert when the arrow appears?
Thanks in advance.
Look is good indicator. I hope i can profit continue using this indicator.
This indicator repaint hard. Discard it IS the wisdom.
Can you send to me the mql4 file of lucky reversal indicator at *********@gmail.com please?
It repaints
Please can you make a Lucky Reversal indicator for MT5 with pop alert. My email is *************@gmail.com. Thank you.
Hi there, I want a mq4 file of lucky reversal indicator. Also can you suggest the auto bot which are available with you which i can buy. I am a new trader i want to start with not expensive bot at beginning. Your help is much appreciated.
Thanks & Regards,
Ashish
Buenos días, muy buen indicador, indicador Lucky Reversal Metatrader 4, seria posible ponerlo automático como un robot que abra y cierre posiciones, así sea con algún costo o tener los parámetros con los que opera, gracias. Mi correo es ***********@gmail.com para que por favor me envíen información.
Very good indicator. Could you add an alert when the arrow appears? My email is **************@hotmail.com.
Thanks in advance
Hello, can send this indicator with alert in my email ***********@gmail.com
Please can you make a Lucky Reversal indicator for MT5. My email is ************@gmail.com
Hi, good day! I have an issue about the lucky reversal for mt4 and the buy sell arrow indicator on mt5. Just this week, when the buy/sell arrows appear and execute and order, it repaints and goes to stop loss. Hope you can help me with this. Thank you so much.
Dear Franco, all such indicators are repainting.
It repaints ...
It's a good indicator. Could you send the source code to me. My email is: ***********@gmail.com. Thank you very much.
La riverniciatura lo rende inattendibile, puoi eliminarla?
Can we get the same exact indicator for mt5, with the same big arrows and thick lines, please.
Dear NelsonFX, please see here: https://www.best-metatrader-indicators.com/mt5-buy-sell-arrow-indicator/

