Submit your review | |
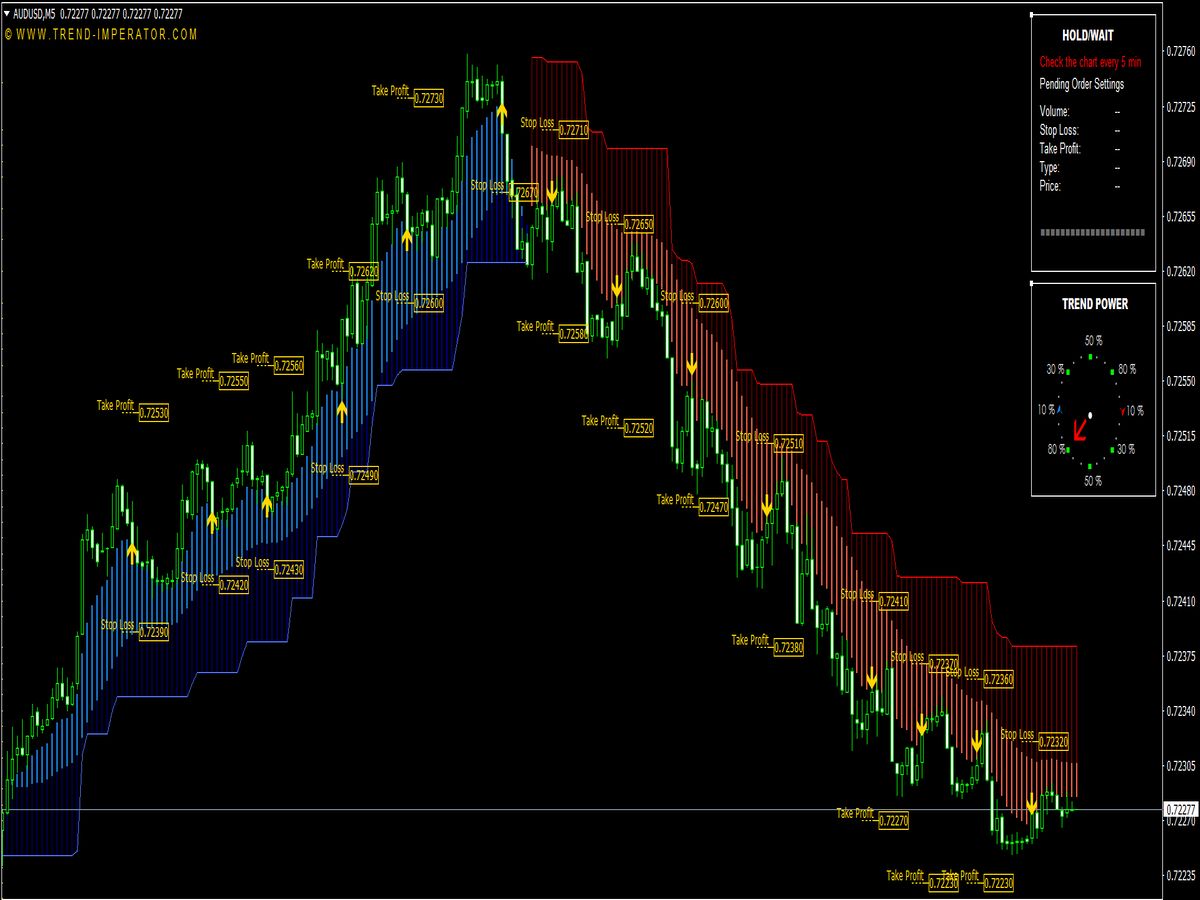
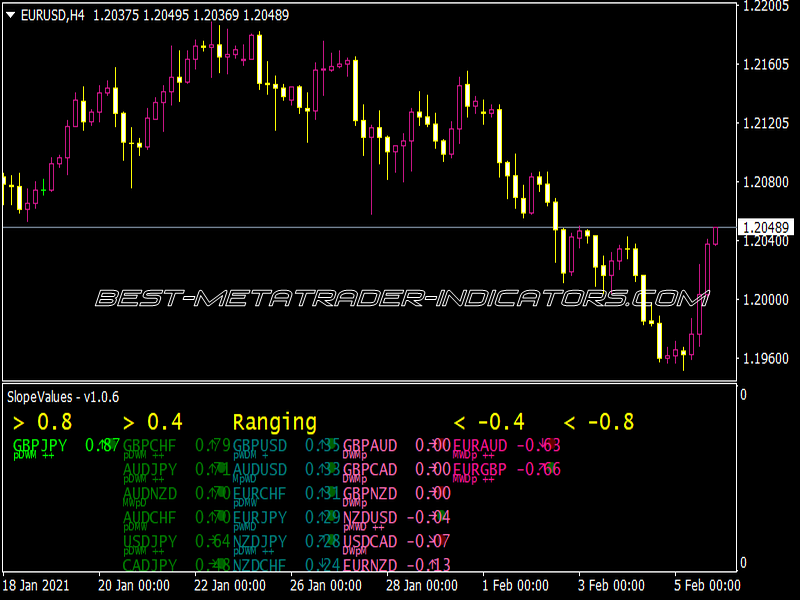
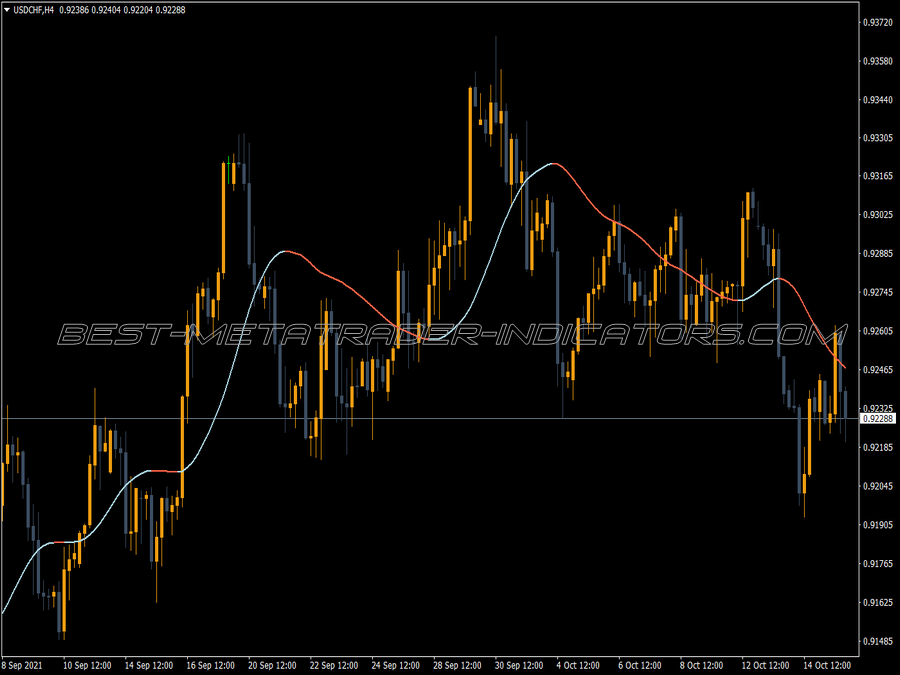
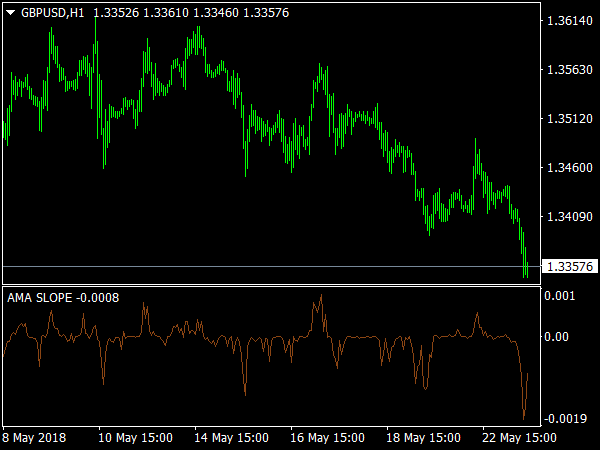
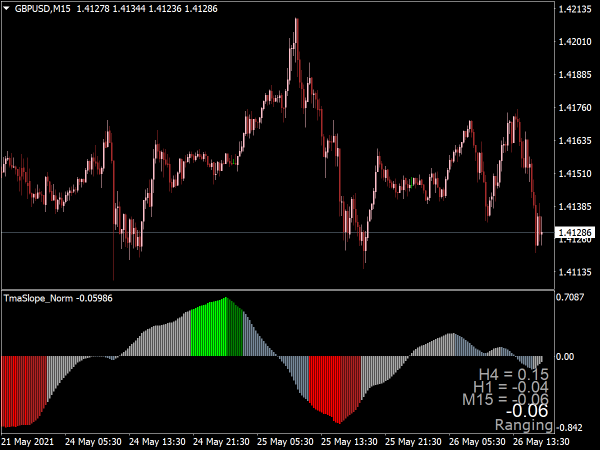
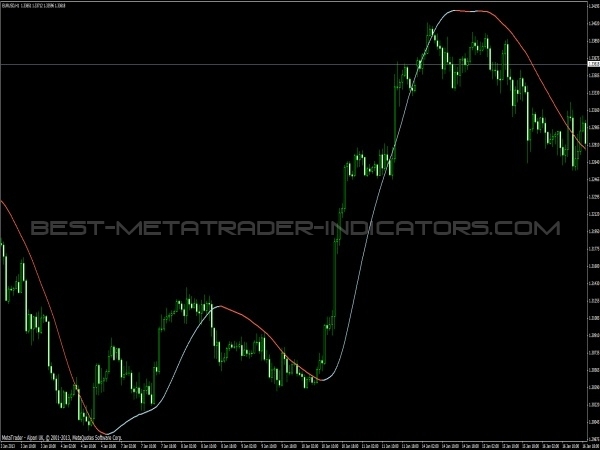
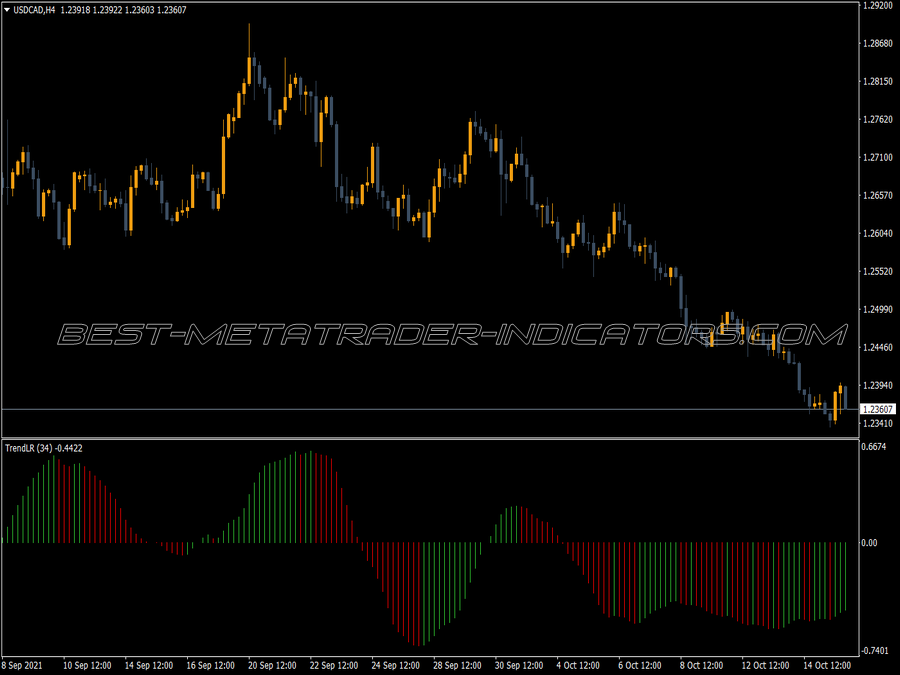
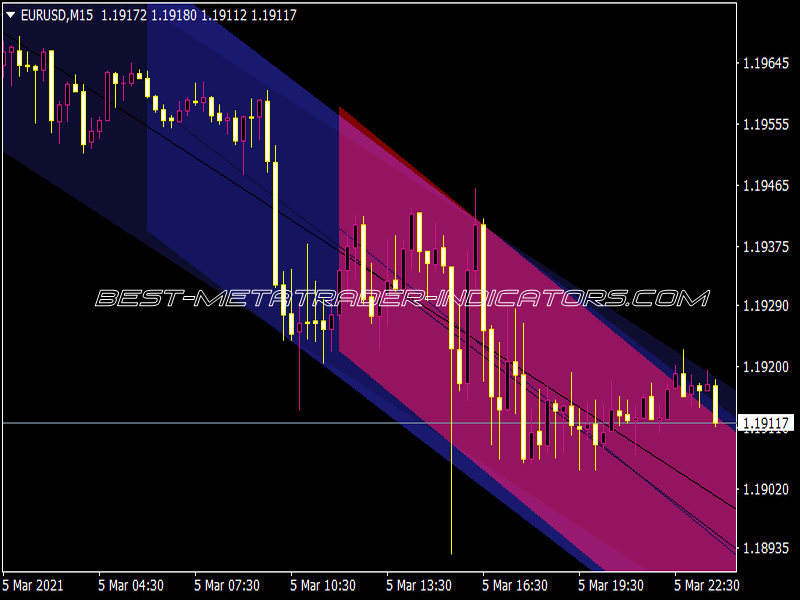
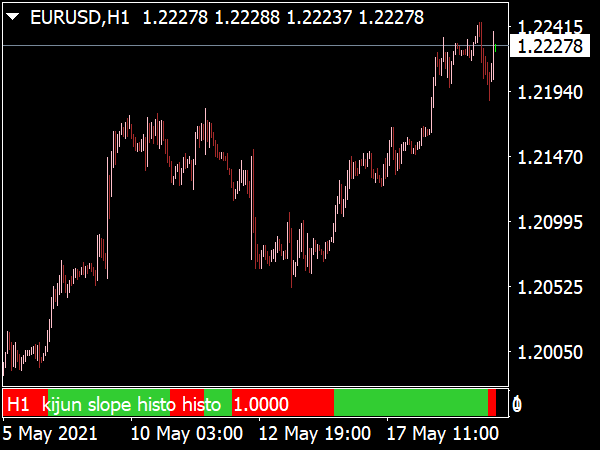
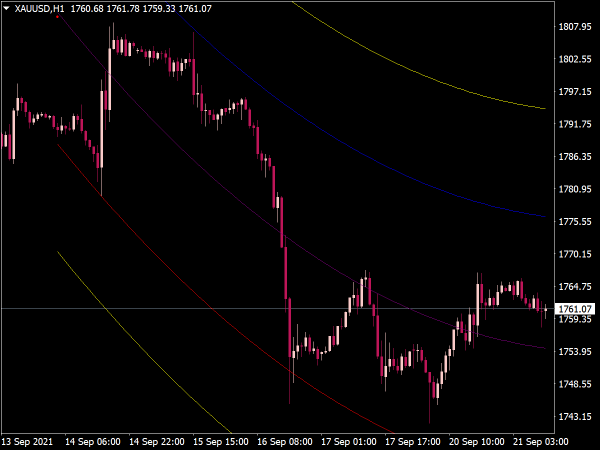
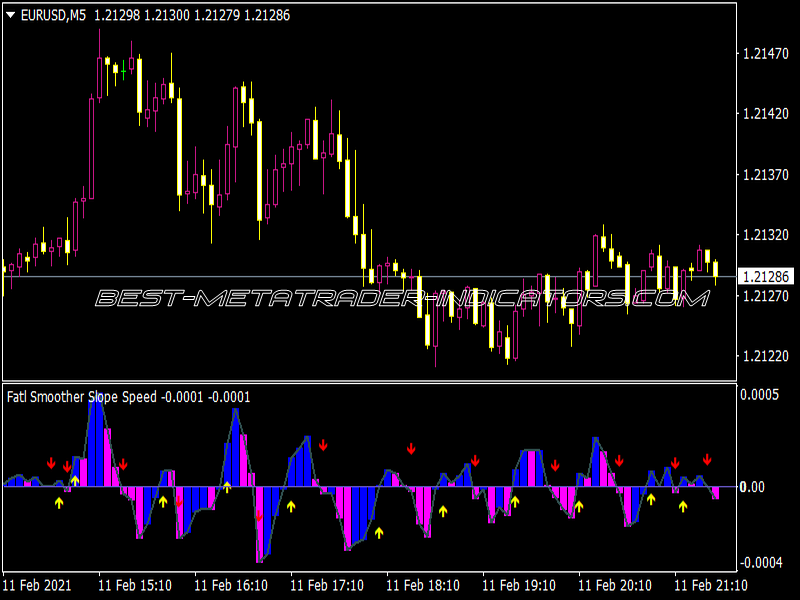
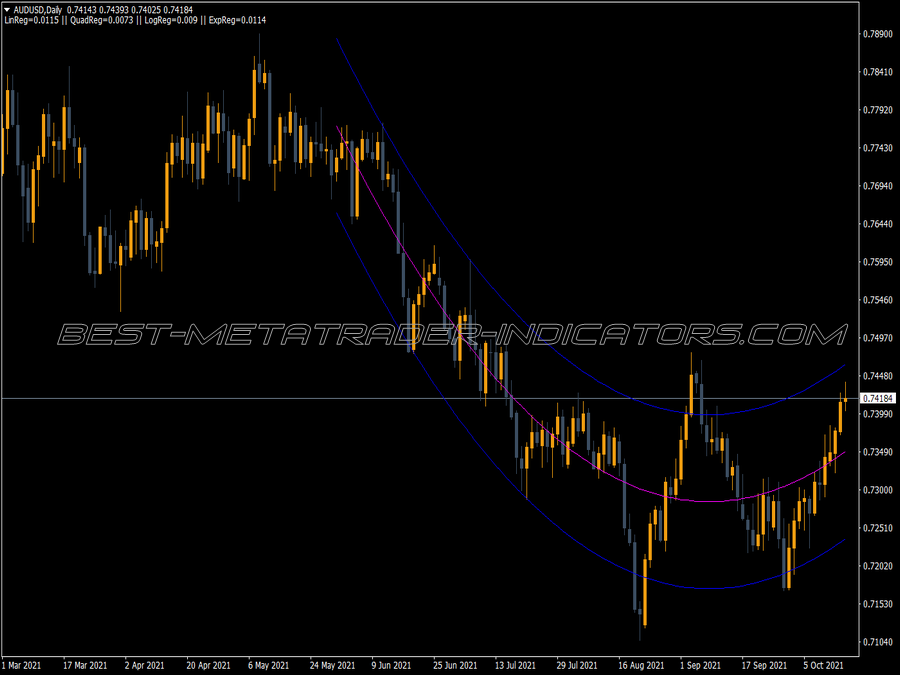
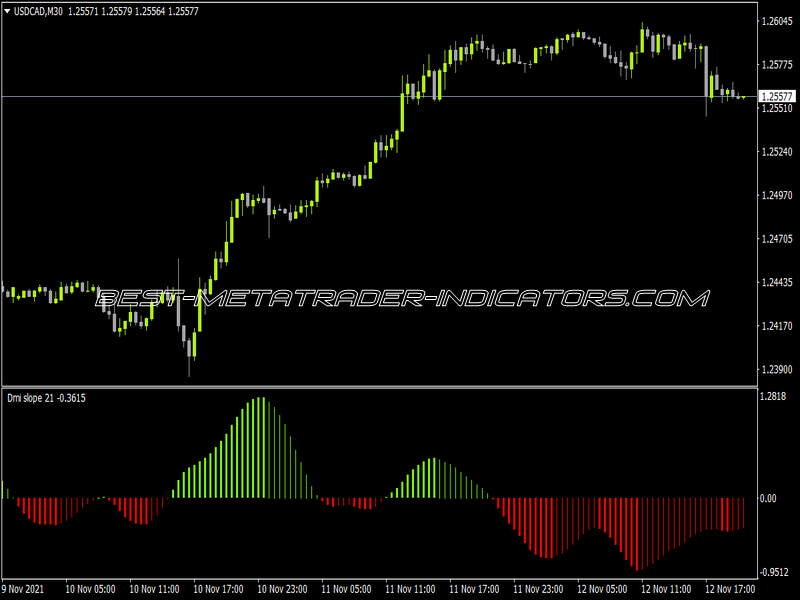
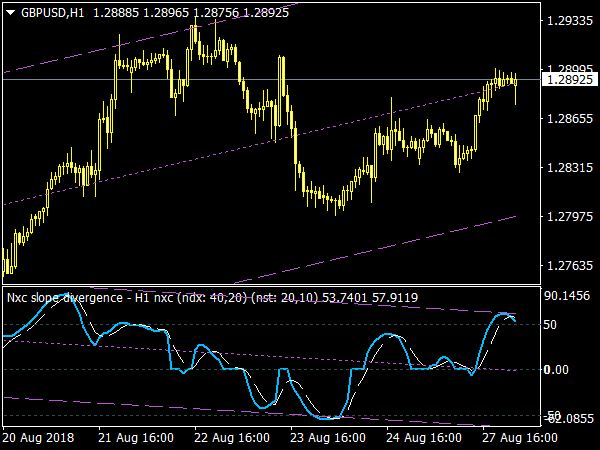
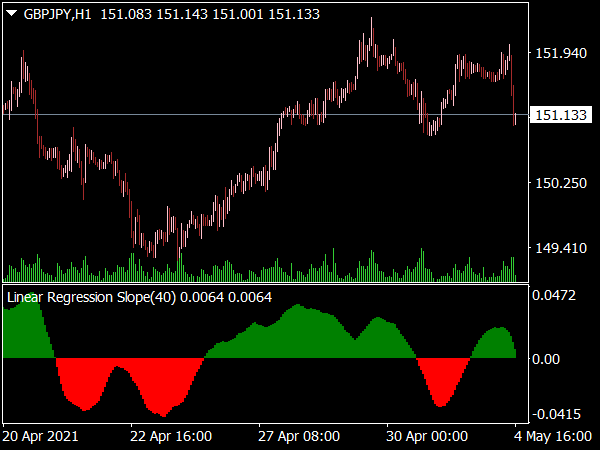
Linear Regression Slope Indicator plots the slope of the linear regression channel.
Useful for:
1. Determining the strength of the trend – the higher the slope, the steeper the trend and higher the momentum. Higher slope indicates that price is advancing quicker and has stronger momentum. Lower slope indicates weakness in price and reluctance to reach new highs (or lows).
2. Separating trending and ranging periods – a small value indicates that the market is in range. Values between -1 pip and 1 pip indicates that price is barely advancing, that trend is weak and therefore price is in a ranging period.
3. Generates signals when the indicator crosses the zero line.
