Submit your review | |
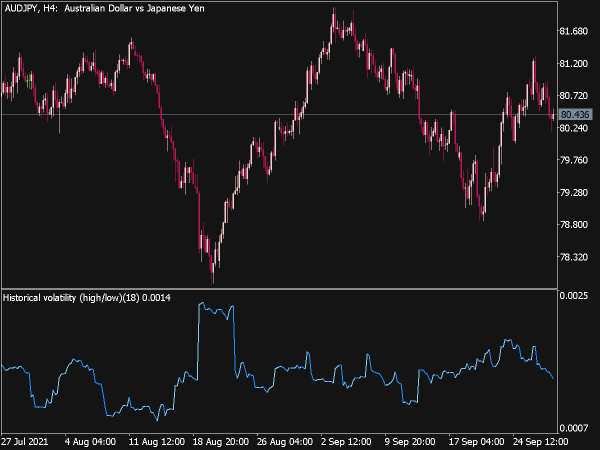
Especially in options trading, it is common to use implied volatility. Historical volatility, on the other hand, is usually ignored, which is a mistake. After all, it is the basis of the concept of expansion and contraction that dominates the markets. The use of historical volatility has become known above all through the 6/100 approach of Toby Crable and Greg Morris. You put the volatility of a period of six bars, usually days, in connection with a period of 100 bars.
The standard deviation of the logarithmic price change is used as the historical volatility:
(Standard deviation(log(price(0) / price(1), 6))) / ( Standard deviation(log(price(0) / price(1), 100)))
Since volatility is cyclical, low values mean that breakouts and trends are imminent in the future. High values, on the other hand, indicate that prices have moved too far from their average value in the short term, they will either take a break or run back. The rise usually means a trend-directed movement of prices, the fall usually, but not always, the formation of a sideways movement.
Historical volatility has a high autocorrelation, i.e. it tends to maintain a movement once taken. Therefore, their statements have much more stability than those of all other indicators. Nevertheless, there are also back and forth movements in the middle area that are difficult to interpret. One should combine the 6/100 approach with the NR4 or NR7 of Toby Crable, the value of the indicator should be below 50%.
📌 More Great Indicators and Trading Systems for MT4 or MT5
- Best-Rated MetaTrader Indicators
- Volatility 2 Step Alerts Indicator

- Volatility Quality Zero Line

- Lentz Volatility Indicator

- MTF High Low Indicator for MT5

- Directional Volatility

- Volatility V2 Indicator

- B-Kaufman Volatility Indicator (MQL5)
")
- Highest High Lowest Low SR

- Standard Deviation of High/Low…

- Parkinson Hist Volatility Indicator

- Volatility Band Indicator

- Volatility Arbitrage Indicator

- Volatility Ratio Indicator (MQL5)
")
- Volatility 2 Step Indicator

- 2 Medians of High-Low Channels

- Gann High Low Activator Jma

- MACD MTF with High/Low…

- ATR Volatility Oscillator

- Volatility Band V2 Indicator

- Average Volatility Oscillator

- Non-Repainting and Non-Lagging Indicators