Submit your review | |
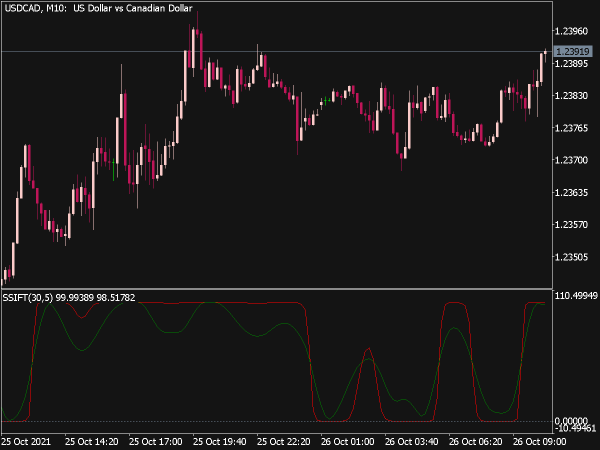
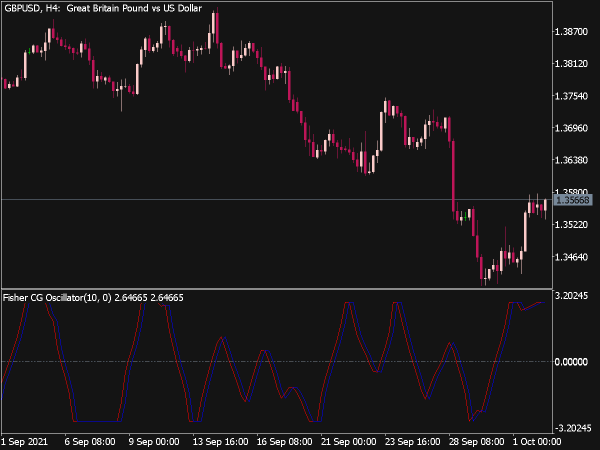
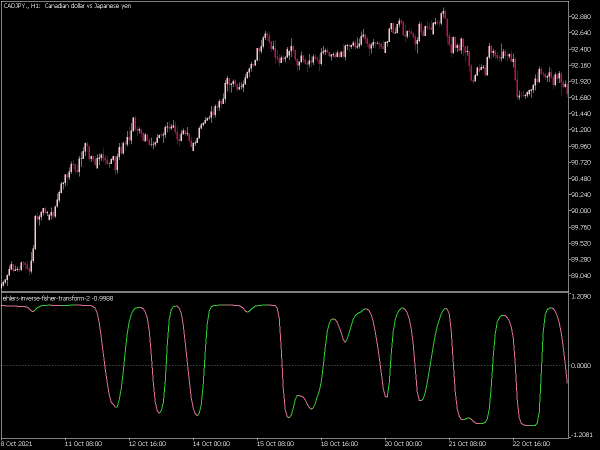
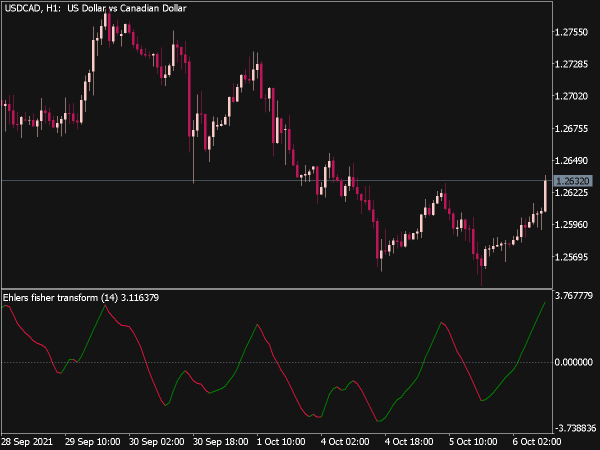
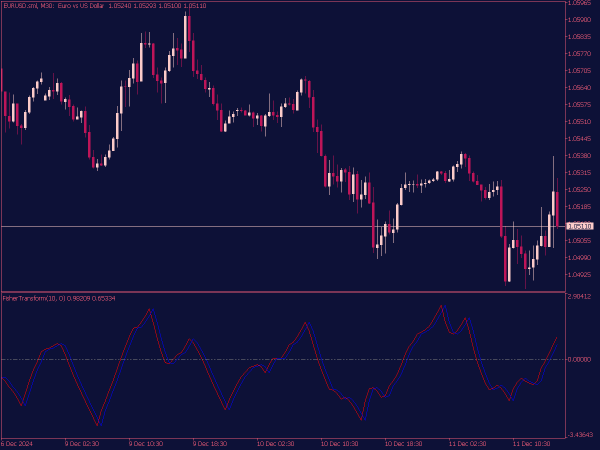
The Fisher Indicator, also known as the Fisher Transform, is a technical analysis tool that converts price data into a Gaussian normal distribution. It was developed by John F. Ehlers and is primarily used to identify potential price reversals and entry/exit points in financial markets. The indicator produces oscillating values typically between -1 and 1, with a higher value indicating an overbought condition and a lower value an oversold condition.
Traders often use the Fisher Indicator alongside other indicators to confirm signals, as it can enhance the identification of trends and fluctuations in market momentum. By highlighting significant price moves and divergence, it can help traders make more informed decisions.
1. Basic Reversal Strategy
One of the simplest strategies utilizing the Fisher Indicator is the basic reversal strategy. This approach involves watching for the indicator to reach extreme values, which signal potential overbought or oversold conditions:
Overbought Signal: When the Fisher Indicator crosses above +1.5, it suggests that the asset is overbought. Traders can look for selling opportunities, entering a short position once the indicator starts to fall back below +1.5.
Oversold Signal: Conversely, when the indicator crosses below -1.5, it indicates that the asset is oversold, signaling a potential buying opportunity. Traders can enter a long position when the indicator moves back above -1.5.
This strategy works best in range-bound markets where price tends to oscillate between high and low levels. However, caution is necessary during strong trends, where prices can remain overbought or oversold for extended periods.
2. Divergence Trading
Divergences between the Fisher Indicator and price movements can provide critical insight into potential reversals. This strategy focuses on identifying instances where price action is diverging from the Fisher Indicator signals:
Bullish Divergence: A bullish divergence occurs when the price forms new lows while the Fisher Indicator records higher lows. This indicates that the momentum of the downward trend is weakening, signaling a potential reversal to the upside. Traders could enter a long position upon confirmation, such as a price breakout above the previous high or a rise in the Fisher Indicator above zero.
Bearish Divergence: A bearish divergence happens when the price makes new highs while the Fisher Indicator forms lower highs. This suggests a weakening momentum in the upward trend, indicating a possible reversal to the downside. Traders could short the asset upon confirmation with additional technical signals such as a break below a support level.
3. Trend-Following Strategy
The Fisher Indicator can also be effectively used in trend-following strategies:
Trend Confirmation: First, establish the overall market trend using other indicators like moving averages (e.g., a 50-day or 200-day moving average). The Fisher Indicator can serve as a timing tool for entries and exits within that trend.
Buy in Uptrends: In a confirmed uptrend, wait for the Fisher Indicator to show an oversold condition (crossing below -1.5) and then crosses back above zero. This signals a continuation of the uptrend, prompting traders to enter long positions.
Sell in Downtrends: In a confirmed downtrend, watch for the Fisher Indicator to show overbought conditions (crossing above +1.5) and then crosses back below zero. This signals a continuation of the downtrend for potential short entries.
By aligning trades with the prevailing trend, traders can increase their odds of success.
4. Combining with Other Indicators
The Fisher Indicator is further refined when used in conjunction with other technical analysis tools:
Moving Averages: Pairing the Fisher Indicator with a moving average can offer a comprehensive view of market trends. For instance, use a 50-day moving average for trend direction while the Fisher Indicator provides entry and exit signals.
RSI (Relative Strength Index): Using the Fisher Indicator alongside the RSI can enhance decision-making. If both indicators show overbought or oversold conditions, their combined signals strengthen the case for entering trades.
Volume Analysis: Integrating volume data can also confirm the strength of signals generated by the Fisher Indicator. For instance, a bullish signal accompanied by increasing volume indicates strong buying interest.
5. Using Stop-Loss and Take-Profit Levels
Risk management is crucial in any trading strategy. Implementing stop-loss and take-profit orders ensures disciplined trading and minimizes potential losses:
Setting Stop-Loss: Place a stop-loss just below support levels for long positions or above resistance levels for short positions. Consider the average true range (ATR) to decide on the appropriate distance.
Take-Profit Levels: Determine take-profit targets based on previous price swings, key levels of support and resistance, or a certain risk-to-reward ratio, such as 1:2 or 1:3.
A well-defined risk management plan complements the use of the Fisher Indicator and helps traders navigate both winning and losing trades effectively.
Conclusion
The Fisher Indicator can be an invaluable tool for traders, providing insights into market dynamics and potential reversals. By employing strategies such as basic reversals, divergence trading, trend-following, combining with other indicators, and adhering to solid risk management techniques, traders can enhance their trading outcomes.
As with any trading tool, it’s essential to practice these strategies in a demo environment before using real capital to ensure a full understanding of the indicator, its strengths, and its limitations. Continuous education and adaptation to changing market conditions will further improve trading proficiency.
