Submit your review | |
The Engulfing Candle Indicator is a popular tool among traders using MetaTrader 4 (MT4) to identify potential market reversals based on candlestick patterns. This indicator highlights bullish and bearish engulfing patterns by placing arrows on the chart, making it easier for traders to spot trading opportunities.
Understanding Engulfing Patterns: An engulfing pattern occurs when a small candle is followed by a larger candle that completely engulfs it. A bullish engulfing pattern happens at the end of a downtrend, with the second candle being a strong bullish one. Conversely, a bearish engulfing pattern appears at the end of an uptrend, where a strong bearish candle engulfs the previous bullish candle. These patterns signal momentum shifts and potential trend reversals.
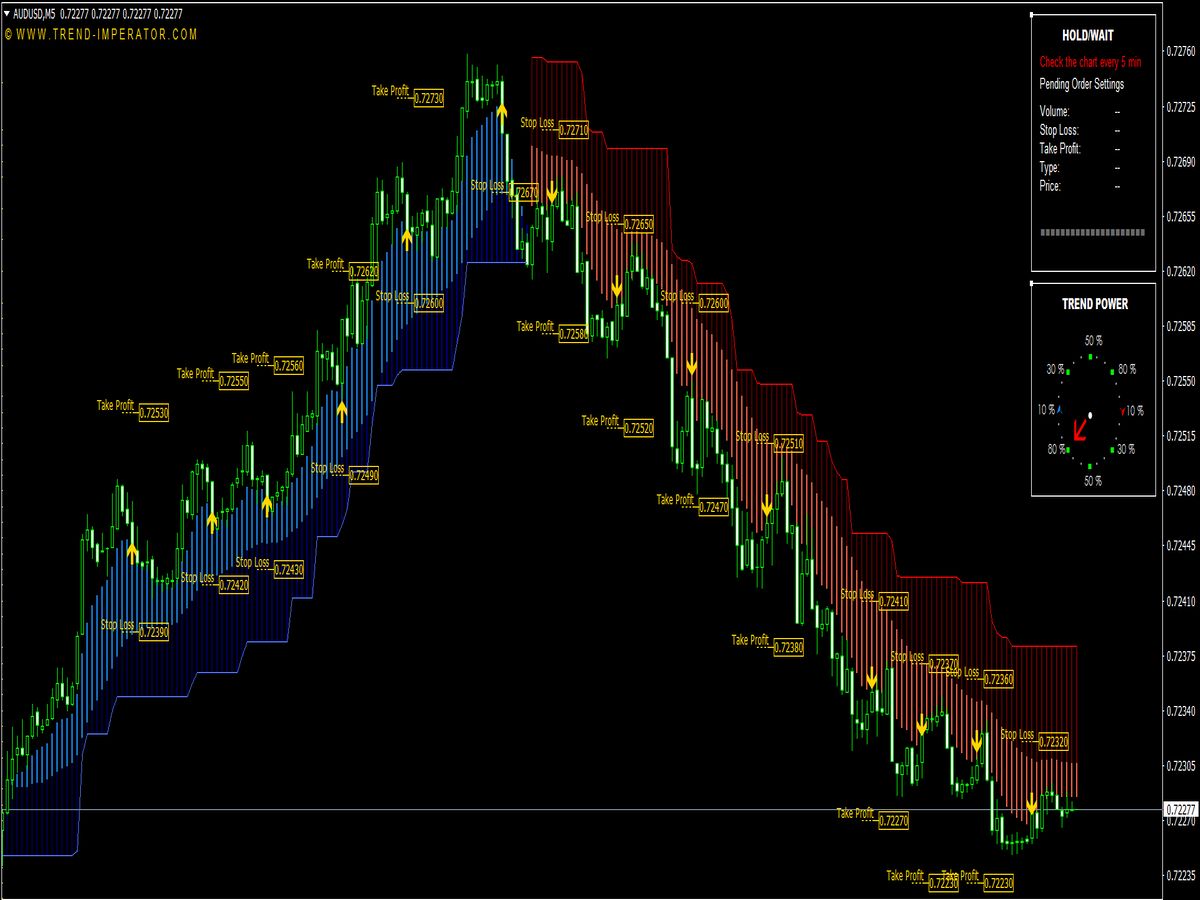
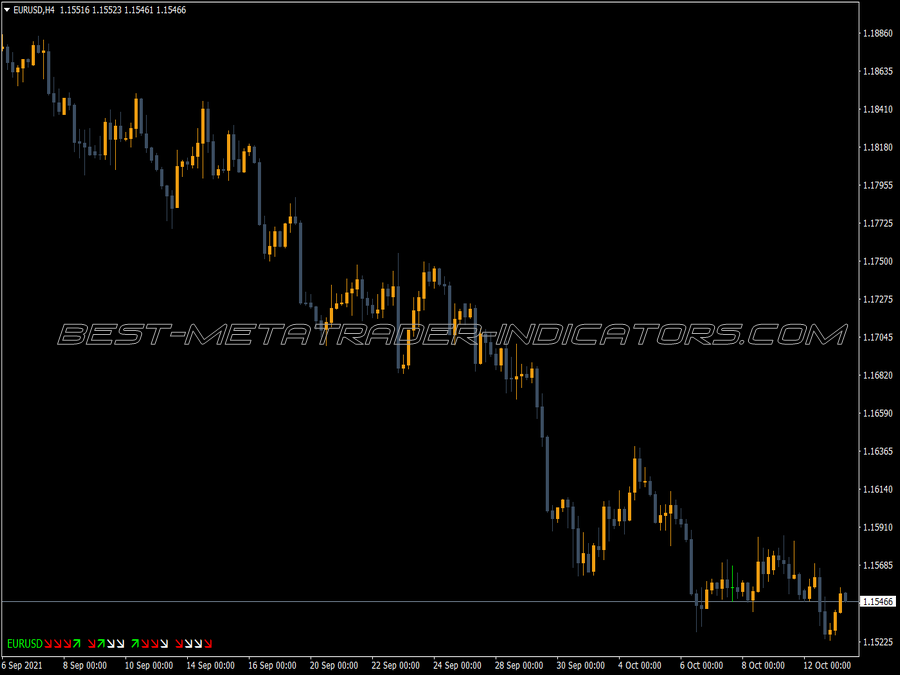
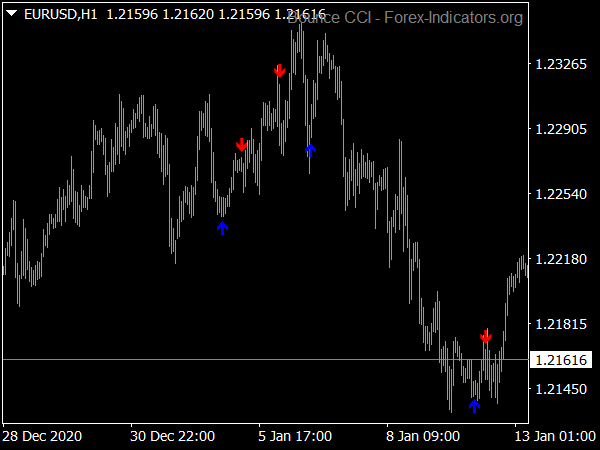
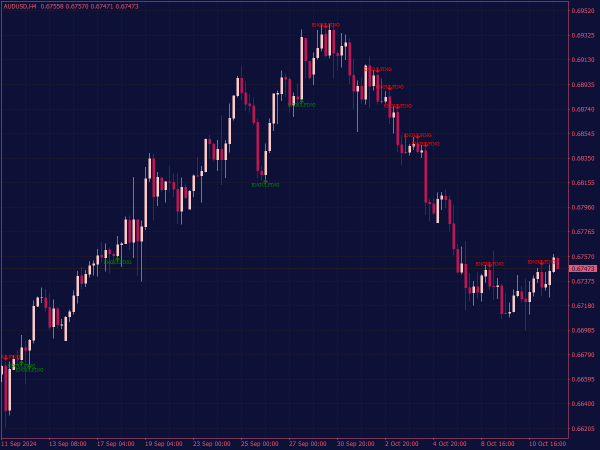
Using the Indicator: When trading with the Engulfing Candle Indicator, look for the arrows that indicate the presence of an engulfing pattern. A green upward arrow signifies a bullish engulfing, suggesting potential buying opportunities, while a red downward arrow indicates a bearish engulfing, signaling possible sell opportunities. It’s crucial to confirm these signals with additional analysis, like support and resistance levels or trend lines, to increase the probability of a successful trade.
Tips for Trading with the Engulfing Candle Indicator:
1. Time Frame Selection: Choose appropriate time frames based on your trading style. Shorter time frames (like M5 or M15) may yield more frequent signals but require quick decision-making, while longer time frames (H1 or H4) may provide more reliable signals.
2. Confirmation: Always seek confirmation from other technical indicators or chart patterns. Using oscillators, like the RSI or MACD, can help verify the strength of the engulfing signal. Look for divergence or overbought/oversold conditions as additional confirmations.
3. Risk Management: Implement strict risk management strategies. Always set stop-loss orders to protect your capital, placing them just beyond the high or low of the engulfing candle. Position sizing should correspond to the volatility of the asset and your trading strategy.
4. Profit Targets: Set realistic profit targets based on support and resistance levels, Fibonacci retracement levels, or a multiple of your risk (e.g., 2:1 risk-reward ratio). Adjust your take profit levels according to market conditions and volatility.
5. Avoiding False Signals: Be cautious of false signals that can occur during periods of low volatility or within consolidating markets. Look for clear trends leading up to the engulfing pattern to increase its reliability. Additionally, consider news events that may impact price movements.
6. Backtesting: Before applying this approach in live trading, backtest the Engulfing Candle Indicator using historical data to assess its effectiveness. Analyze past performance and adjust your strategy to improve results.
7. Psychological Readiness: Trading can be emotionally taxing. Ensure that you are psychologically prepared to follow your strategy and manage losses. Keeping a trading journal can help track your performance and emotional state.
In summary, the Engulfing Candle Indicator provides a visual and effective way to identify potential trading opportunities based on candlestick patterns. By incorporating confirmation signals, practicing sound risk management, and maintaining psychological discipline, traders can utilize this indicator to improve their trading outcomes. As with any trading strategy, continuous learning and adaptation are vital for long-term success.
ℹ️ What are Bullish and Bearish Engulfing Patterns?
Engulfing pattern is a reversal candlestick pattern. This pattern is composed of two candles with opposite color bodies. The reason behind the engulfing pattern is fairly simple. An engulfing pattern occurs when the bulls (or bears) are running out of steam during the first candle, and the opposite side of the market makes a strong move during the second candle.
There are two types of engulfing pattern:
• Bullish engulfing pattern
• Bearish engulfing pattern
Bullish Engulfing Pattern
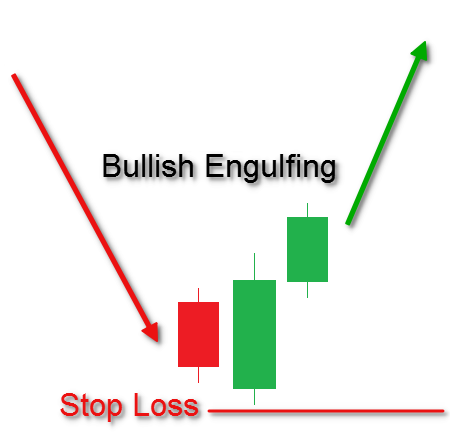
A bullish engulfing pattern occurs in a downtrend and consists of a white candle (bullish candle) whose body completely engulfs the body of the previous down candle (bearish candle).
We can see that the second candle's body is bigger than the previous candle. The second candle engulfs the first bearish candle. This suggests that the bulls have taken control of a pair's price movement from the bears. This suggests that pair's downtrend has finished and an uptrend or a correction should now occur.
Trade using Bullish Engulfing Pattern
On confirmation of bullish engulfing pattern we can enter a long position. Stop loss can be placed just below the bottom of the formation. Engulfing patterns in general have no inherent take profit level. So take profit orders should be placed according to results of other analyses.
Bearish Engulfing Pattern
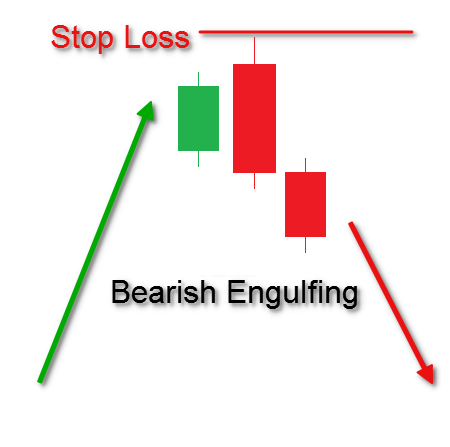
A Bearish Engulfing Pattern is the exact opposite of bullish engulfing pattern; it occurs in an uptrend and consists of a down candle (black candle) whose body completely engulfs the body of the previous up candle (white candle).
We can see that the second candle's body is bigger than the previous candle. The second candle engulfs the first bullish candle. This suggests that the bears have taken control of a pair's price movement from the bulls. This suggests that pair's uptrend has finished and a down trend or a correction should follow.
Trade using Bearish Engulfing Pattern
On confirmation of bearish engulfing pattern that is when the second candle closes, we can enter a short position. Stop loss can be placed just above the bottom of the formation. While trading this pattern we should know that this pattern sometimes does not result in an actual reversal of the trend, but can often result in a consolidation or a retrace instead.
The buying/selling pressure that causes the engulfing candle may occur due to spontaneous events such as large non-speculative flows, or profit taking near a significant support or resistance level.
