Submit your review | |
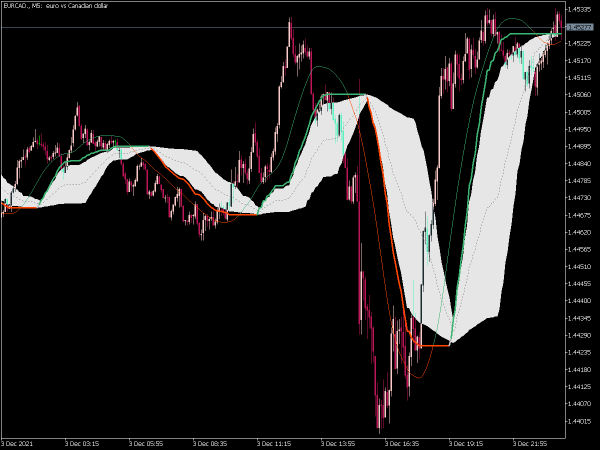
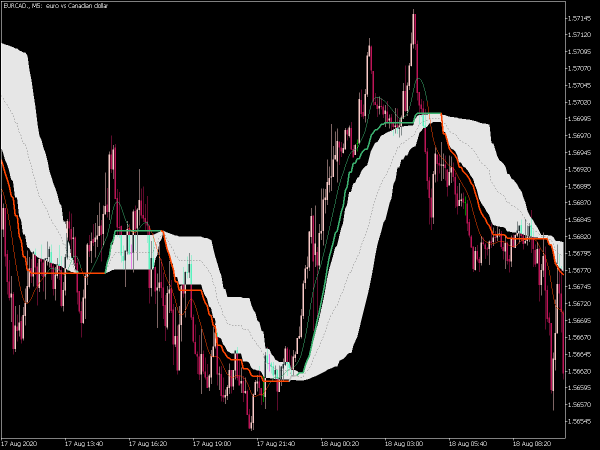
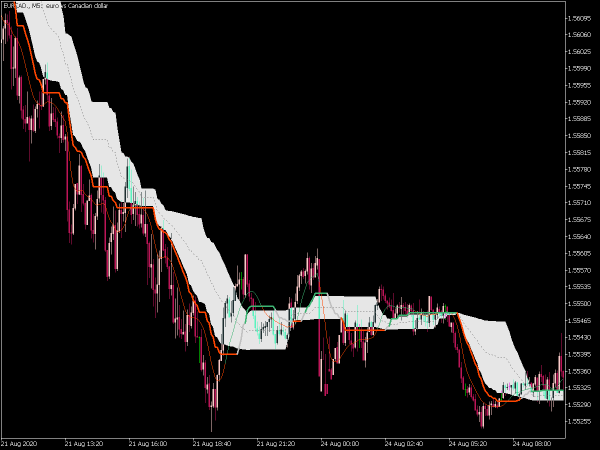
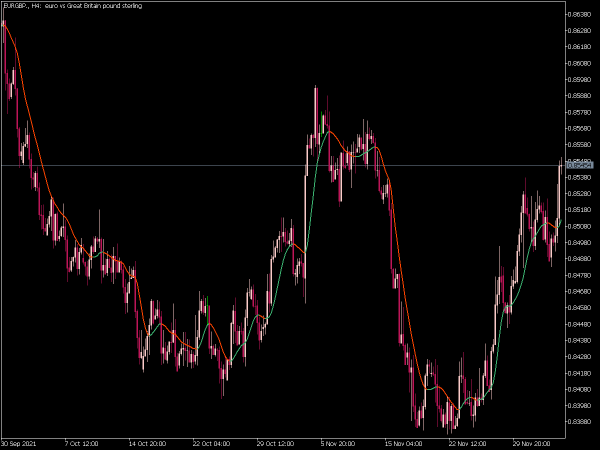
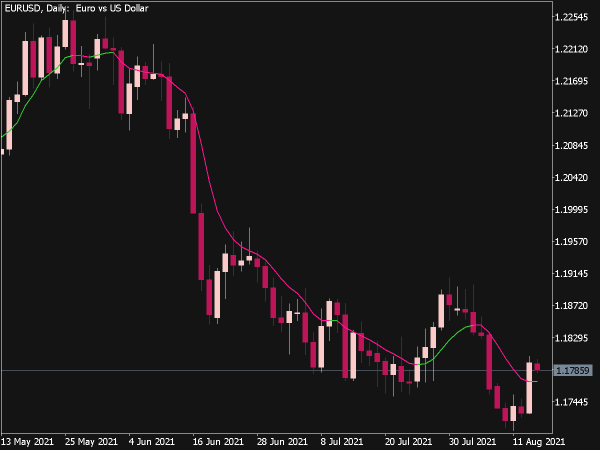
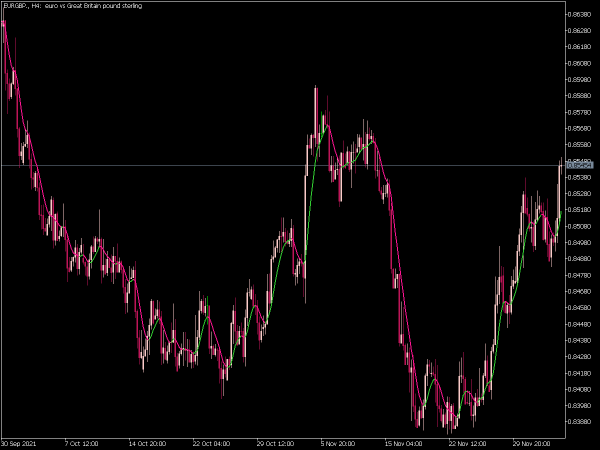
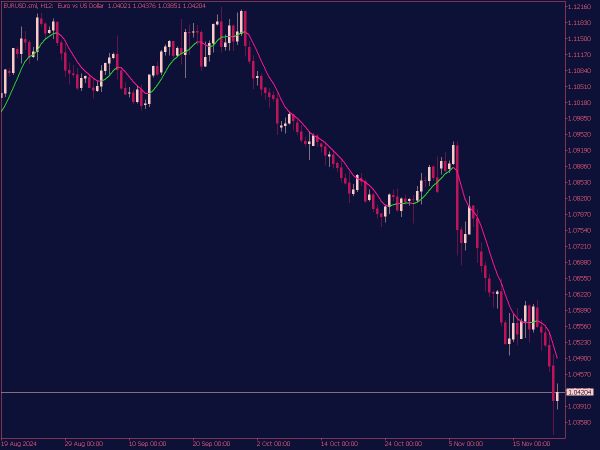
The EMA MTF (Exponential Moving Average Multi-Time Frame) Indicator is a technical analysis tool used in trading to identify trends by calculating the exponential moving average of an asset's price across multiple time frames. Unlike a simple moving average, the EMA gives more weight to recent prices, making it more responsive to price changes.
Traders often utilize the EMA MTF to observe the convergence or divergence of EMAs across various time frames, helping them to make informed decisions on entry and exit points. For instance, a trader might look for buy signals when a shorter-term EMA crosses above a longer-term EMA across time frames, indicating a potential upward trend.
Here are several trading strategies that can be employed using this indicator:
1. Trend Confirmation: Use the EMA on higher time frames (e.g., daily or weekly) to determine the overall trend and then switch to a lower time frame (e.g., hourly or 15-min) for entry points. Buy when the price is above the higher timeframe EMA and the lower timeframe EMA crosses above the price; sell when below, using a similar crossover.
2. Crossover Strategy: Implement two EMAs on the chart — a shorter period EMA (e.g., 9 periods) and a longer one (e.g., 21 periods). A bullish signal occurs when the short EMA crosses above the long EMA, while a bearish signal appears when the short EMA crosses below.
3. EMA Bounce Trade: Identify key support and resistance levels on higher time frames, then look for price bounces off the EMA on lower time frames. For example, if a price retraces to the 50 EMA on a 4-hour chart after an uptrend, a bounce can indicate a continuation, providing a signal to enter a long position.
4. Multi-Time Frame Divergence: Analyze divergence between price movements and the EMA for potential reversals. For instance, if the price hits new highs but the EMA shows lower highs, this divergence can signal an upcoming reversal, warranting close monitoring and potential trade entry.
5. EMA with Volume Confirmation: Combine the EMA MTF strategy with volume analysis. Look for a cross of the EMA along with an increase in volume as confirmation of the trade signal. For example, an EMA crossover with a surge in buying volume will better confirm a bullish signal.
6. Swing Trading with EMA: Implement the EMA MTF setup to capture short- to medium-term price movements. Use a combination of the daily and hourly EMAs and look for entry points when the hourly chart shows a bounce off or crossover, aligning with the directional bias of the daily EMA.
7. EMA for Scalping: On lower time frames (5-min or 15-min charts), employ a quick EMA crossover strategy. Buy if the short EMA crosses above the long EMA while confirming momentum through other indicators like RSI; sell on a reversal crossover at overbought conditions.
8. Pullback Entries: In a strong trend identified on higher time frames (e.g., 1H, 4H), wait for pullbacks to the EMA on lower time frames before entering in the direction of the trend. For example, enter long when the price retraces to the 200 EMA in an uptrend.
9. Multi-Time Frame Analysis for Risk Management: Use higher time frames for setting stop-loss levels. If trading on a 15-min chart, set your stop-loss just below significant EMAs on a 1-hour or 4-hour chart.
10. EMA Band Trading: Create bands using multiple EMAs (e.g., 50 EMA to denote trend direction and 200 EMA for dynamic support/resistance). In an uptrend, look to buy near the 50 EMA, and in a downtrend, look to sell near the same level on pullbacks.
11. EMA Trendline Breaks: Combine EMA with trendline analysis. If the price breaks above a bearish trendline alongside crossing above the EMA on a lower time frame, this can provide a strong buy signal.
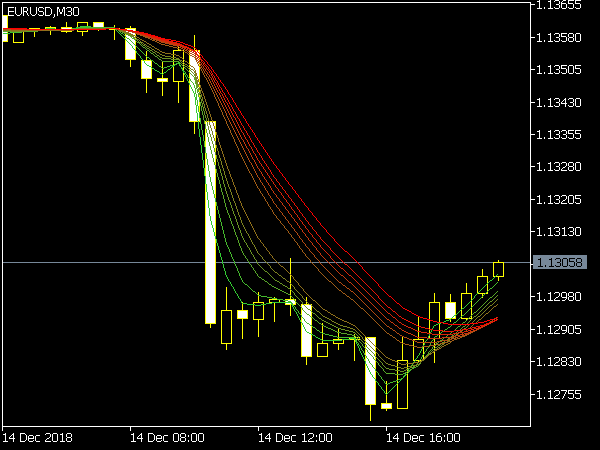
12. EMA Confluence Zones: Use multiple EMAs (e.g., 10, 20, 50) and identify areas where they cluster close together on the chart. These confluence points can act as strong support or resistance levels, providing potential entry points when prices test these areas with accompanying candle patterns.
When applying these strategies, remember to adapt them to your trading style, the specific market conditions, and incorporate proper risk management techniques. It’s also crucial to backtest any strategy and practice on a demo account to gain confidence before implementing it in live trading.

