Submit your review | |
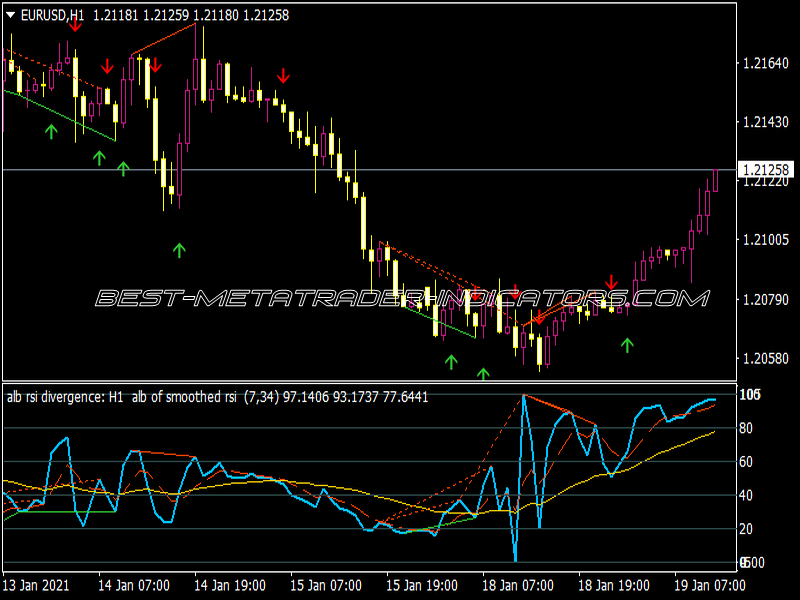
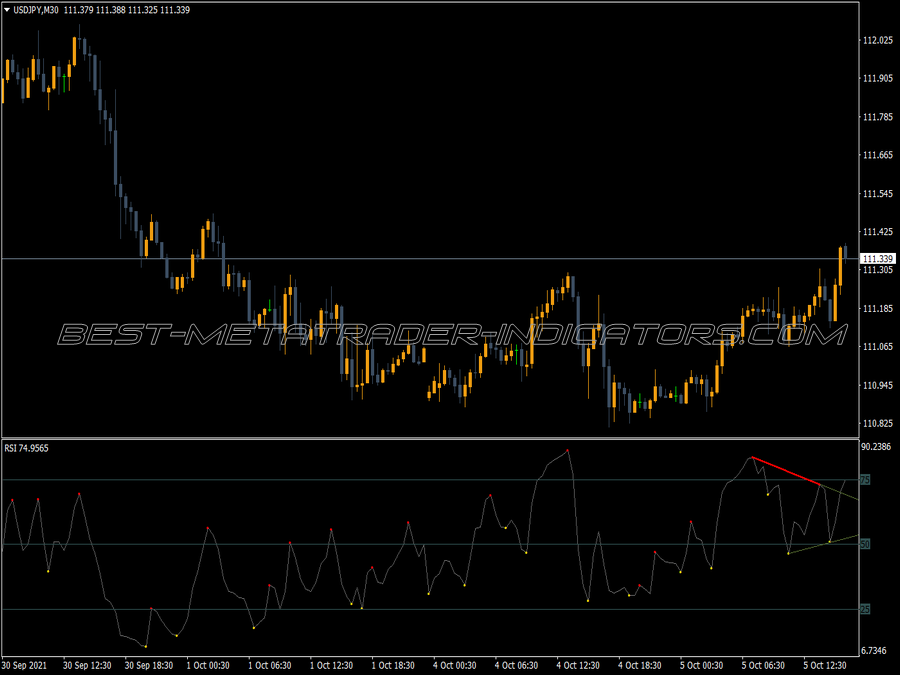
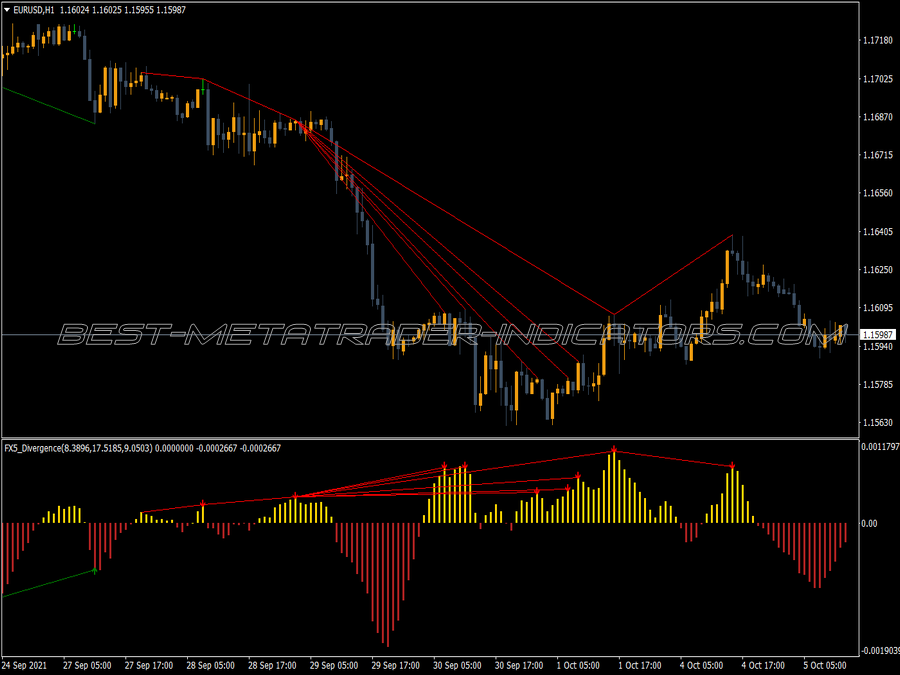
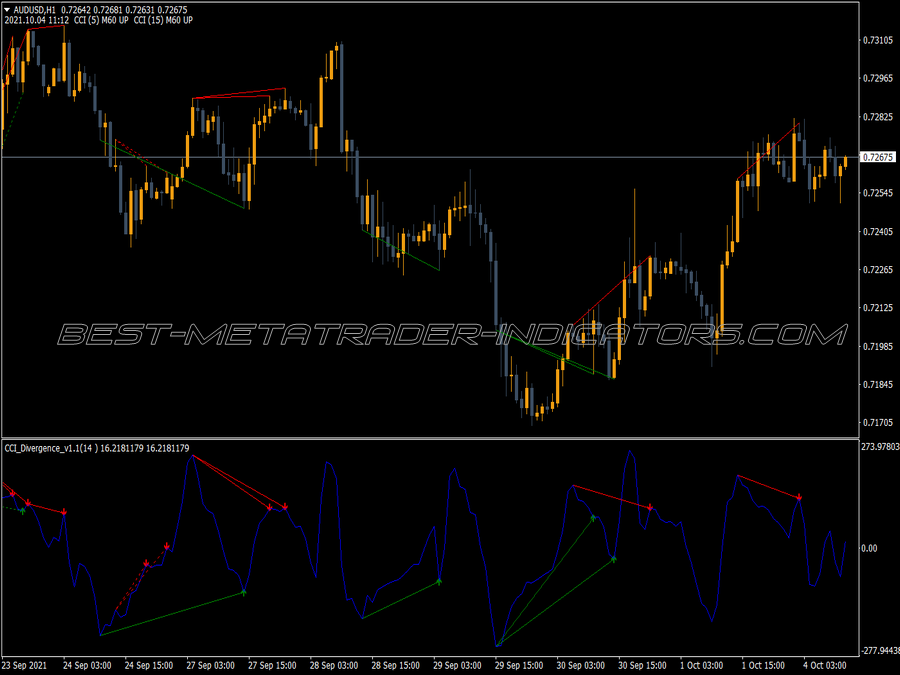
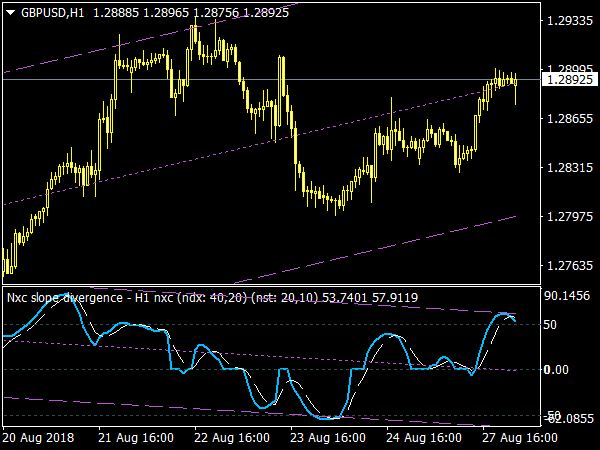
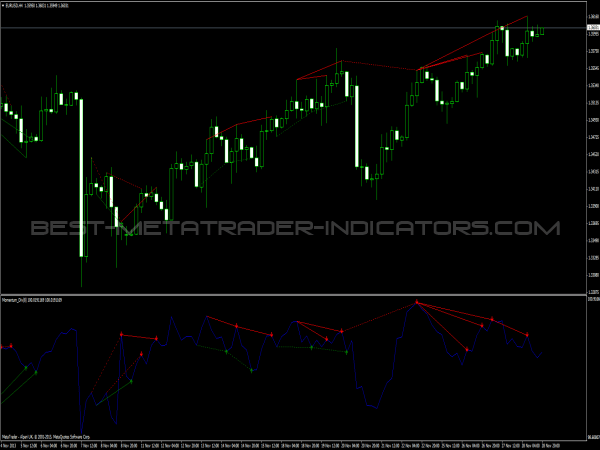
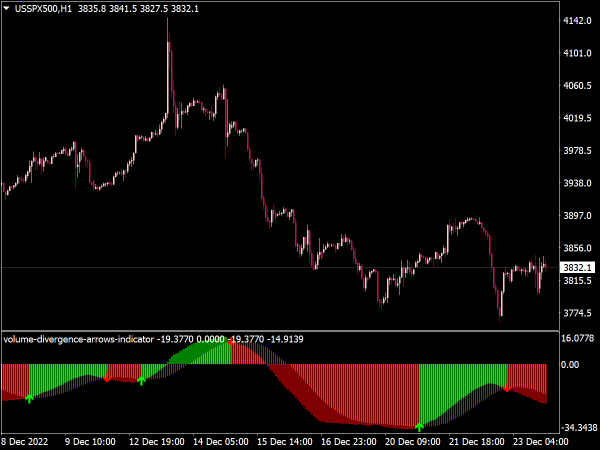
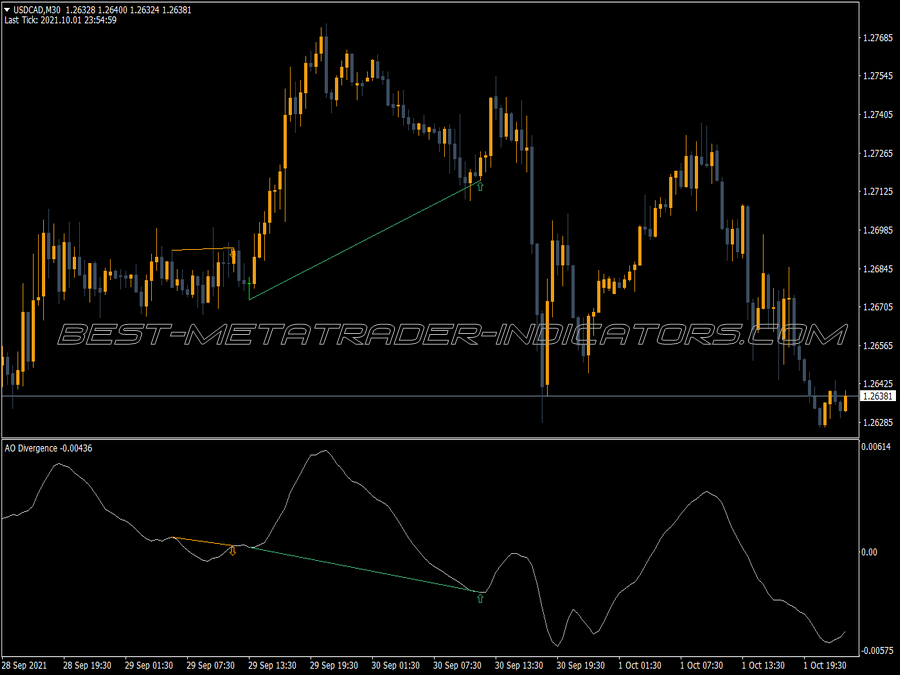
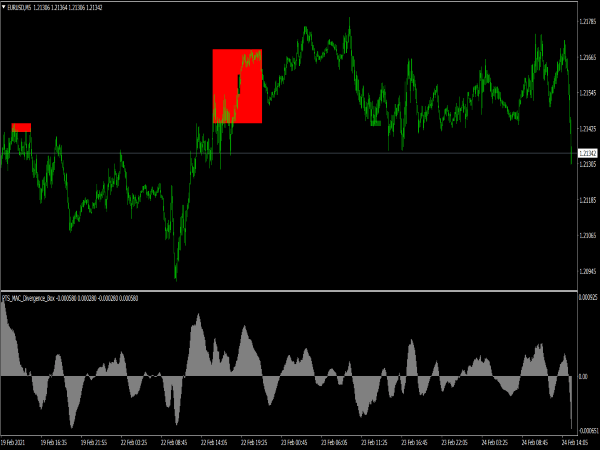
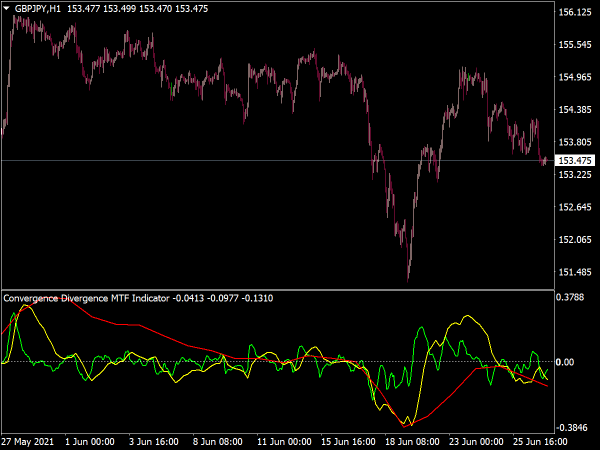
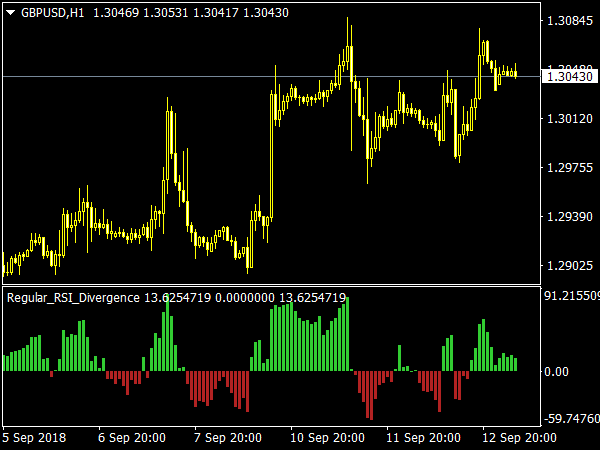
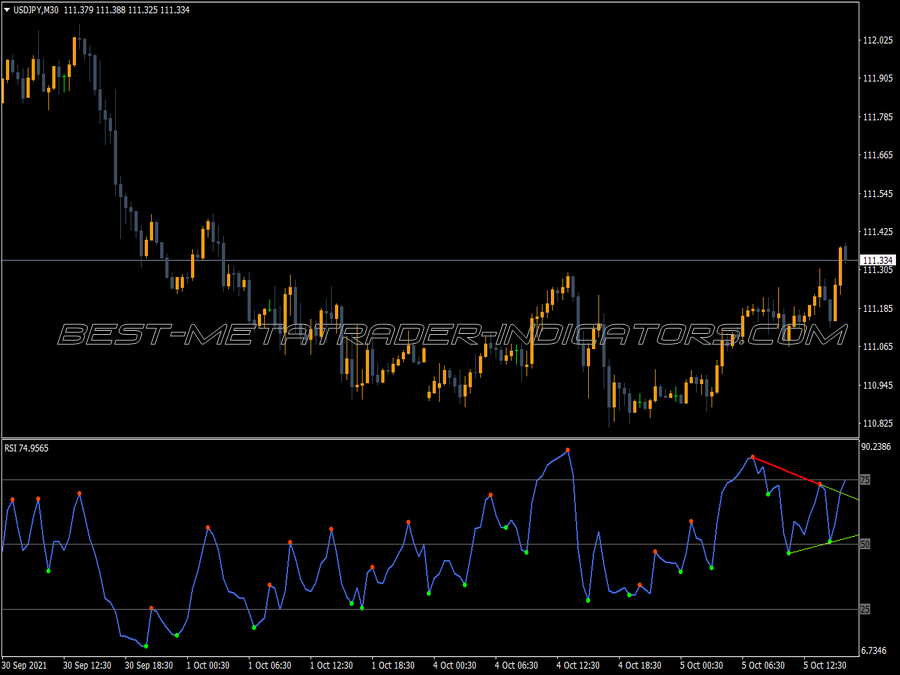
The RSI Divergence Indicator is a technical analysis tool that utilizes the Relative Strength Index (RSI) to identify potential reversals in price trends by spotting divergences between the RSI and the price action of an asset.
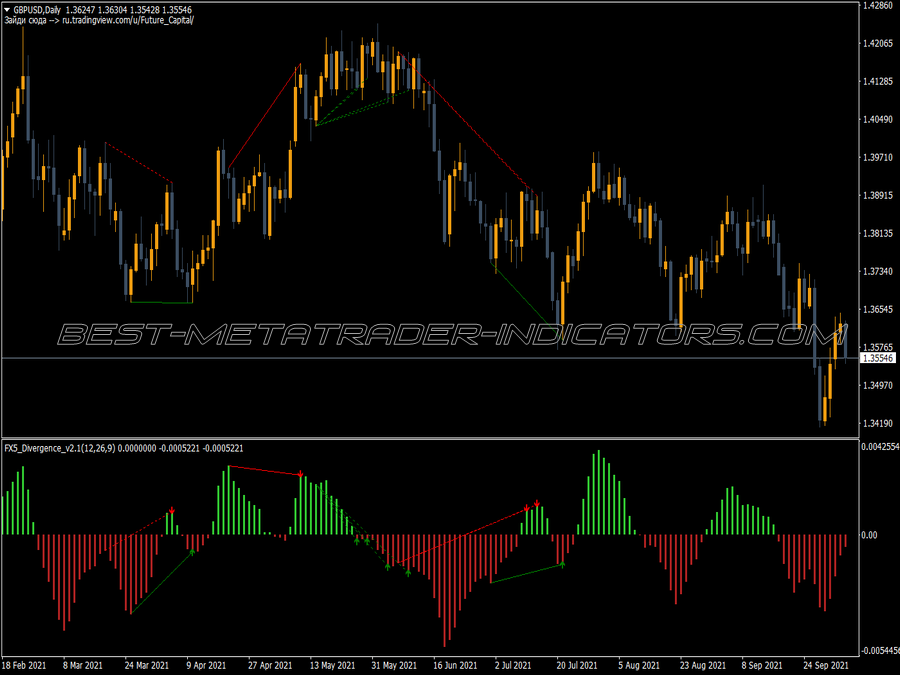
Bullish divergence occurs when the price makes a lower low while the RSI makes a higher low, suggesting a possible upward reversal, while bearish divergence is identified when the price makes a higher high and the RSI forms a lower high, indicating a potential downward reversal.
Traders often use this indicator to enhance their decision-making regarding entry and exit points, improving the overall effectiveness of their trading strategies.
Here’s a list of strategies based on RSI divergence:
1. Classic Divergence: Look for divergence between price action and the RSI. For example, if prices are making higher highs but the RSI is making lower highs (bearish divergence), consider selling. Conversely, if prices make lower lows while the RSI shows higher lows (bullish divergence), consider buying.
2. Convergence Confirmation: Combine RSI divergence with other indicators like moving averages or MACD to confirm potential reversals. This can reduce false signals and increase the probability of a successful trade.
3. Trendline Breaks: Draw trendlines on both price action and RSI. A break of trendline support on RSI during a bullish trend may indicate a potential reversal, while a break of trendline resistance in a bearish trend may signal a buying opportunity.
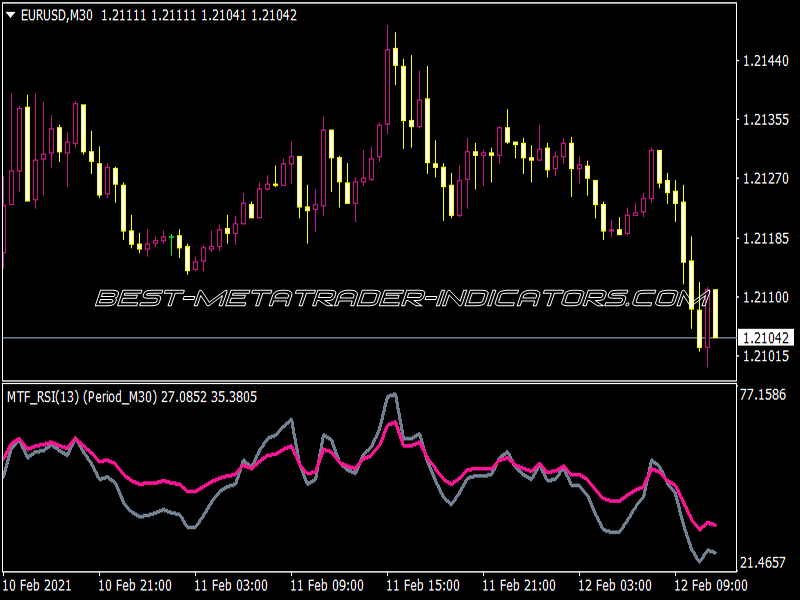
4. Multiple Time Frame Analysis: Check for RSI divergence across different time frames. A divergence on a higher time frame can indicate stronger potential reversals, while confirmations on lower time frames can offer optimal entry points.
5. Overbought/Oversold Levels: Use the RSI overbought (above 70) and oversold (below 30) levels in conjunction with divergence. Confirm the divergence at these levels to increase the likelihood of an effective trade.
6. Bullish/Bearish RSI Signals: Monitor the RSI value; if it crosses above 30 during a bullish divergence or below 70 for bearish divergence, it can serve as an additional trigger for taking a position.
7. Risk Management: Always implement stop-loss orders based on recent swing highs/lows to manage risk, ensuring you limit potential losses in the event of false signals.
8. Volume Confirmation: Analyze trading volume when considering divergence. A significant increase in volume can validate the divergence signal, indicating that the move may have strength behind it.
9. Setting Targets: Establish realistic profit targets based on previous price action and support/resistance levels after recognizing a divergence and entering a trade.
10. Backtesting Strategies: Test your RSI divergence strategy on historical data to understand its effectiveness and tweak your approach based on findings.
These strategies, when executed with discipline, can harness the predictive power of RSI divergence for enhanced trading performance.
