Submit your review | |
Commodity Channel Index is a very common tool among traders for identifying cyclical trends. Donald Lambert developed this oscillator and featured in his book "Commodities Channel Index: Tools for Trading Cyclical Trends".
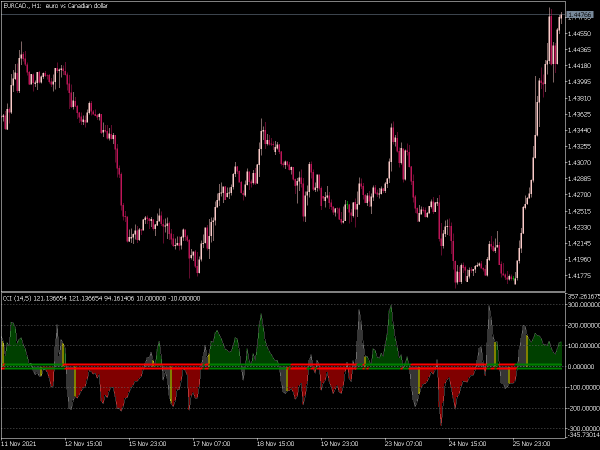
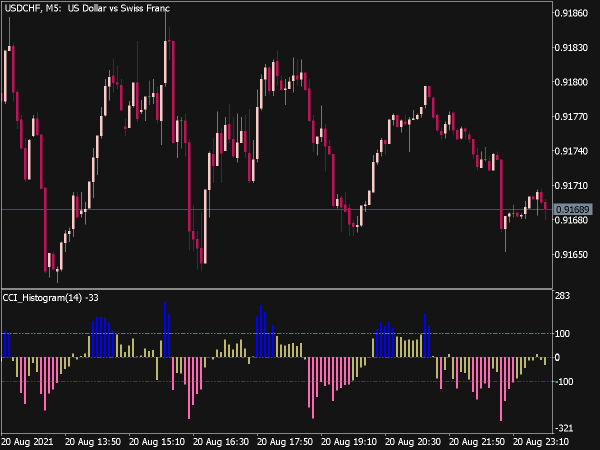
CCI measures the current price level relative to an average price level over a given period of time. CCI is relatively high when prices are far above their average, similarly CCI is relatively low when prices are far below their average. In this manner, we can use CCI to identify overbought and oversold levels.
CCI is calculated as the difference between the typical price of a commodity and its simple moving average, divided by the mean absolute deviation of the typical price. For scaling purposes, Lambert set the constant at 0.015 to ensure that most of CCI values would fall between -100 and +100. The percentage of CCI values that fall between +100 and -100 will depend on the number of periods used. Default period used is 20.
The CCI fluctuates above and below zero. A shorter CCI will be more volatile with a smaller percentage of values between +100 and -100. Conversely, the more periods used to calculate the CCI, the higher the percentage of values between +100 and -100.
CCI can be used to identify overbought and oversold levels. A pair can be called oversold when the CCI dips below -100 and overbought when it exceeds +100. From oversold levels, we can put a long trade when the CCI moves back above -100. From overbought levels, we can put a short trade when the CCI moves back below +100.
Just like other oscillators, concept of divergences can also be applied to increase the reliability of signals. A bullish divergence below -100 would increase the reliability of a signal based on a move back above -100. A bearish divergence above +100 would increase the reliability of a signal based on a move back below +100.
