Submit your review | |
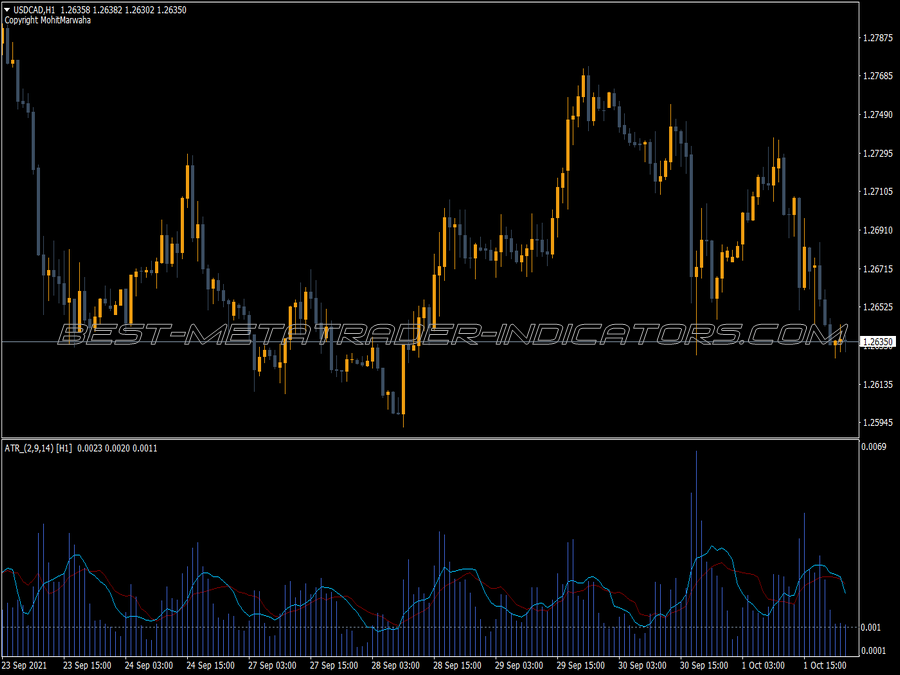
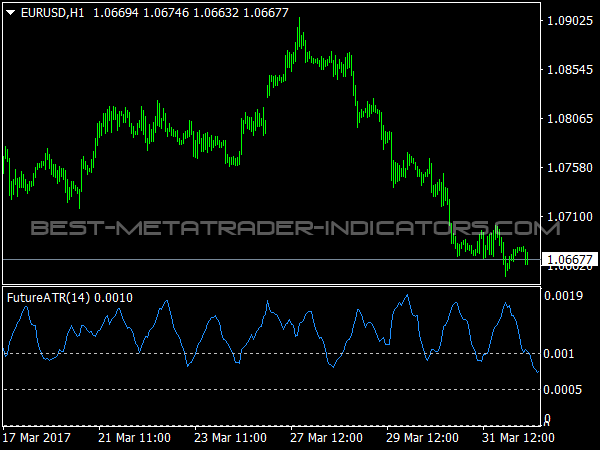
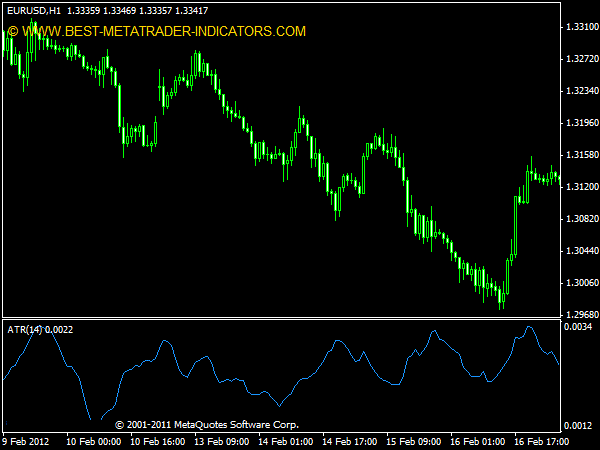
The Average True Range is an indicator developed by J. Welles Wilder, the pioneer of advanced technical indicators. Unlike most of his indicators, this one does not calculate overbought or oversold periods, nor gives signals – this indicators shows the volatility of the market. While most traders ignore it, it is of extreme importance in trading systems.
Calculation of the average true range (ATR) is pretty straightforward for each bar, the True Range is defined as the greater of the following:
1. The current High less the current Low;
2. The absolute value of the current High less the previous Close;
3. The absolute value of the current Low less the previous Close.
Then, this number is averaged (smoothed) using a default 14-period Exponential Moving Average – to reach the Average True Range.
The ATR does not produce clear trading signals and is not designed to generate buysell recommendations. However, when the ATR is at an extreme value (very high or very low) it may signal that the market is at a Bottom or a Top. The true power of the ATR comes into action in trading systems. Trading system developers know that even if you have a profitable trading method, it is a hard process to make it continue to profit when markets change. The main change of the markets is a change in volatility – new forces join the market, making it highly volatile and increasing fluctuations.
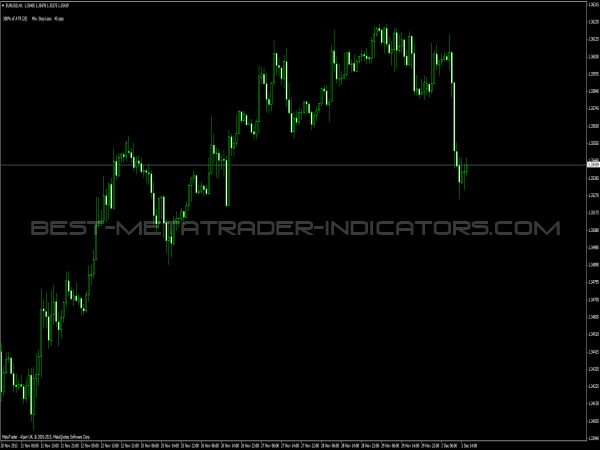
The ATR helps you deal with volatility, making your Expert Advisor automatically adapt to changing volatility. The method of using the ATR is simple: instead of using constant numbers for your stop loss, take profit or stop orders (5 pips, 20 points, etc.), you should use ATR (30% of ATR, for example). This way, you are not limited to constant number but adapt to changes in volatility.
Using ATR you not only adapt to changing volatility, but can also trade the same strategy in several markets – and the strategy automatically changes its stop loss and take profit to adjust to the different environment. The ATR can highly improve your strategy, making it more adaptive and consistent then regular, standard trading systems.
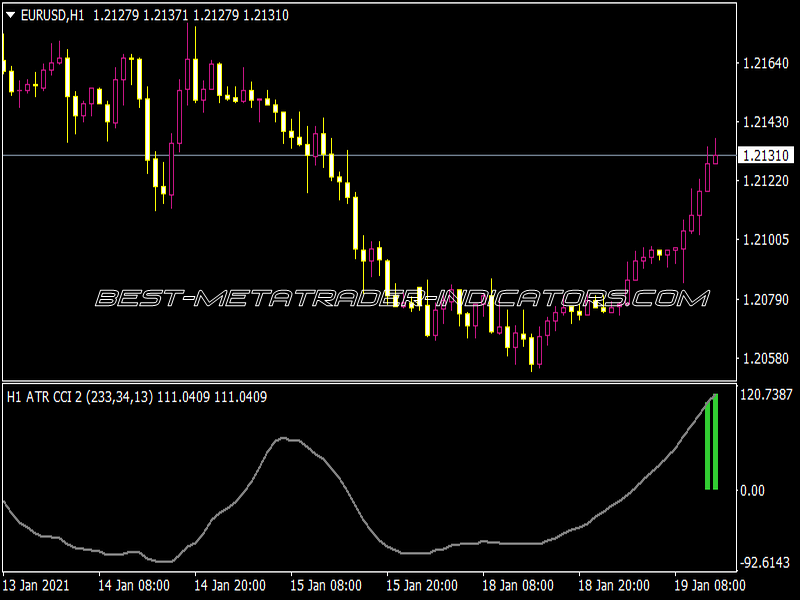
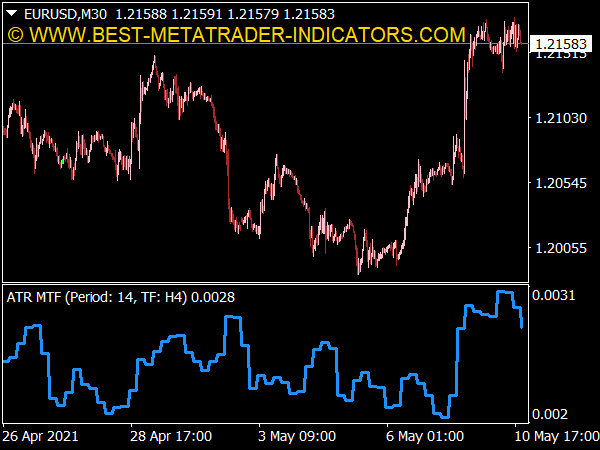
This is not a multi-timeframe ATR. It is a single timeframe ATR that enables the user to select which TF will be displayed.
Great product, simple and reliable code, it works as expected, thank you for both files, was able to make some adjustments. I too use ATR for SL and TP thank you for supporting traders with this product, cheers.
Been looking for this one for a while. I calc my SLs and TPs from higher TFs and when I'm manual backtesting, I constantly have to go to the W1 chart and look it up. Now I don't have to, I just read it straight off the chart I'm on; W1 ATR read on a H4 chart, or D1 ATR read on the M30 chart. I install this in an already existing indicator window with the colour set to "NONE", then I just read it straight from the data box. If you're a big ATR fan like me you'll have whole bunch of them with no colour in the same narrow indicator window with the W1, D1, Current TF ATR. Sweet!
