Submit your review | |
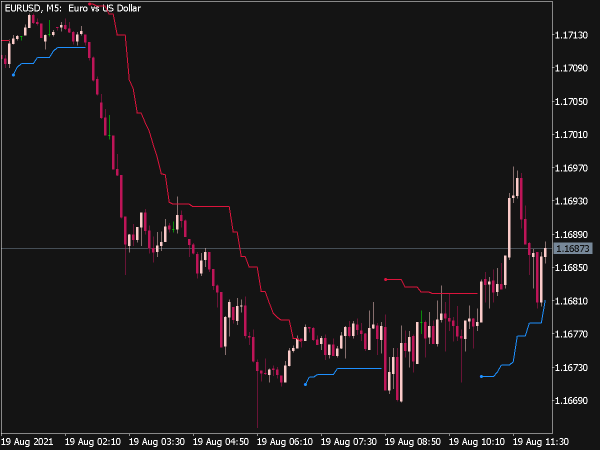
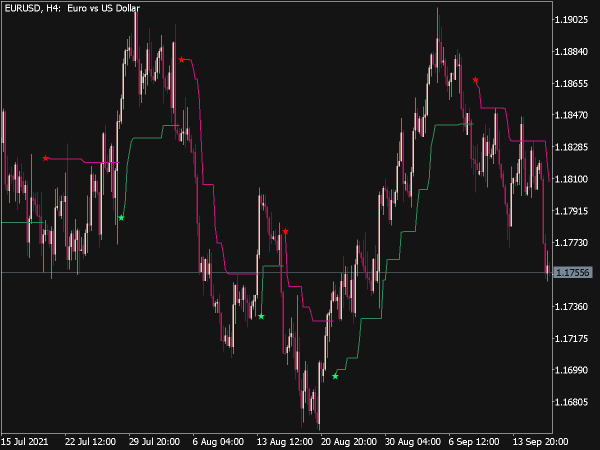
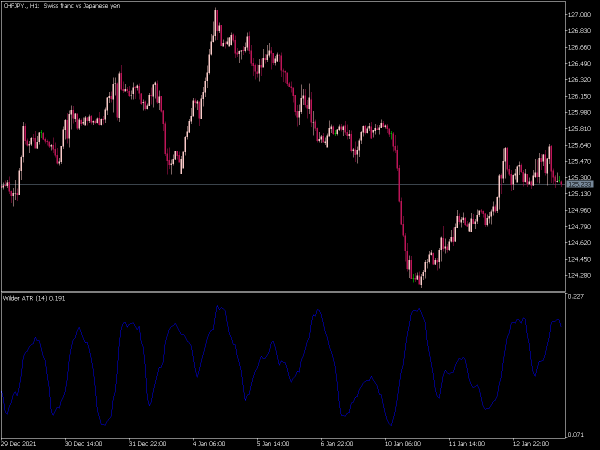
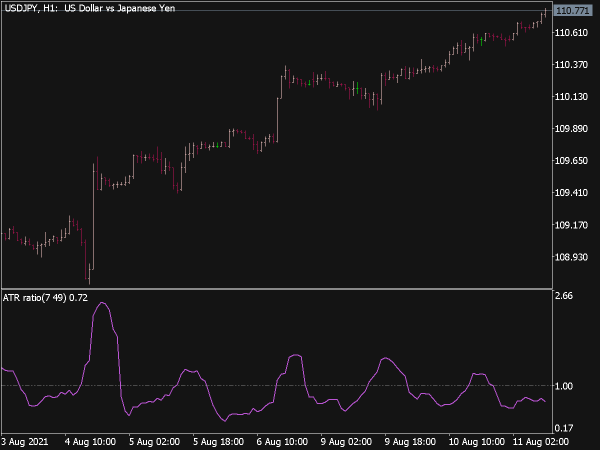
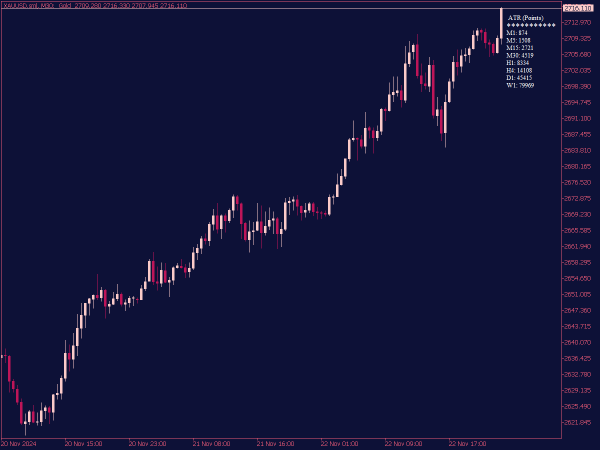
The ATR MTF (Average True Range Multi-Time Frame) Indicator is a technical analysis tool used to measure market volatility across multiple time frames. It extends the standard ATR, which calculates market volatility based on the range of price movement, incorporating readings from different time frames (e.g., daily, hourly, weekly).
This allows traders to assess volatility trends and adapt their trading strategies accordingly. By comparing ATR values across various time frames, traders can identify potential breakout opportunities and manage risk more effectively, as higher ATR readings indicate increased volatility and potential for larger price swings.
Below are some trading strategies that utilize the ATR MTF Indicator:
1. Volatility Breakout Strategy: Identify significant price levels and use the ATR to gauge market volatility. When the price breaks out of a range with a corresponding increase in ATR, consider entering a trade in the breakout's direction.
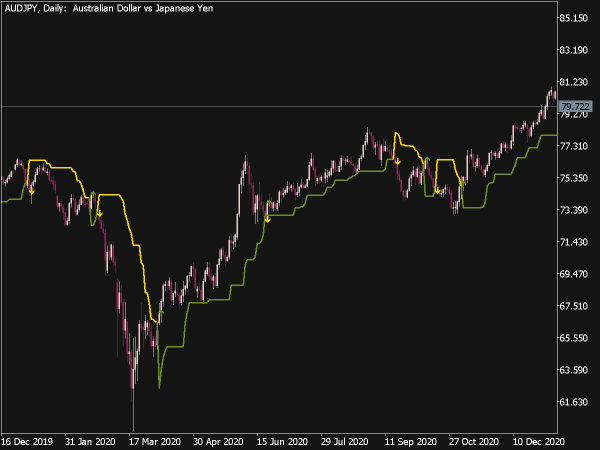
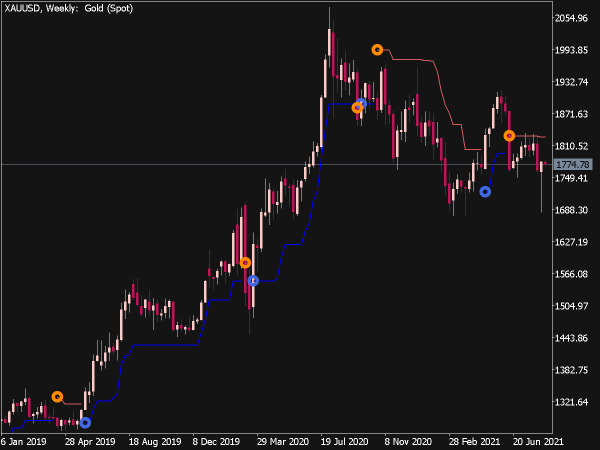
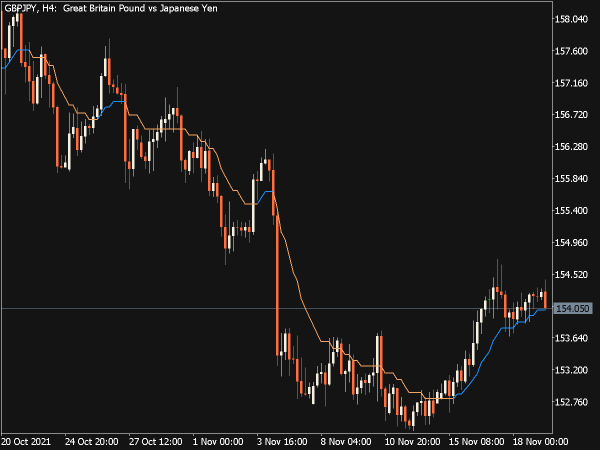
2. ATR Trend Following: Use the ATR's value to set trailing stop-loss orders. As the price trends favorably, adjust the stop-loss based on the ATR level to maximize profits while protecting against reversals.
3. Reversal Trading: When the ATR is at an extreme level, indicating high volatility, look for potential reversal patterns like dojis or pin bars. Enter trades against the prevailing trend, targeting a return to the mean.
4. Range Trading: In low ATR environments, identify support and resistance levels. Buy near support and sell near resistance, keeping an eye on ATR for signals of potential breakouts or trend changes.
5. Multi-Time Frame Analysis: Use ATR across different time frames to confirm trading signals. For example, if the daily ATR indicates high volatility and you spot a setup on a 1-hour chart, this confluence can strengthen your trade rationale.
6. Position Sizing Based on ATR: Determine your position size by calculating risk based on the ATR. The formula involves taking a percentage of the ATR to define your stop-loss distance, ensuring your trades are scaled according to market volatility.
7. ATR Divergence: Look for divergences between price and ATR, where price makes new highs or lows while ATR fails to confirm the movement, indicating potential reversals.
8. ATR as Confirmation for Fibonacci Levels: Use the ATR to validate Fibonacci retracement levels. If the price approaches a significant Fibonacci level with a low ATR, it may suggest a lack of momentum, reinforcing your trade signal.
9. Swing Trading with ATR: Establish your entry and exit points for swing trades based on ATR. Enter trades when the price is significantly deviating from the ATR value, targeting a return to the ATR mean.
10. News Event Trading: Monitor ATR spikes before major news releases to gauge market expectation. Enter trades based on how the price reacts post-release in relation to the ATR.
These strategies highlight how versatile the ATR MTF indicator can be when integrated into various trading systems, allowing traders to adapt to changing market conditions effectively. Remember to backtest and practice these strategies in demo accounts before applying them in live markets.
