Submit your review | |
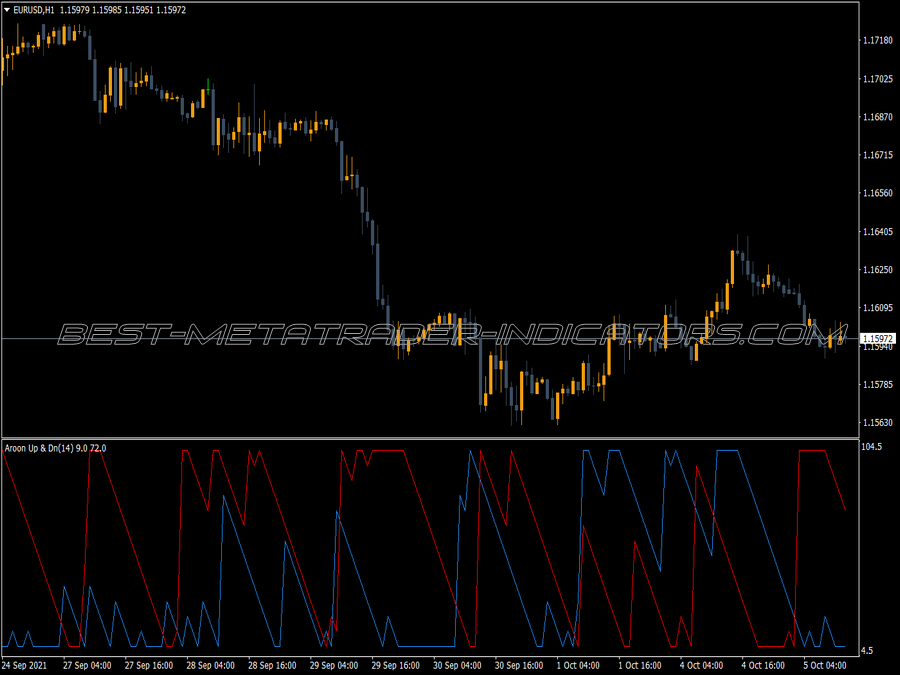
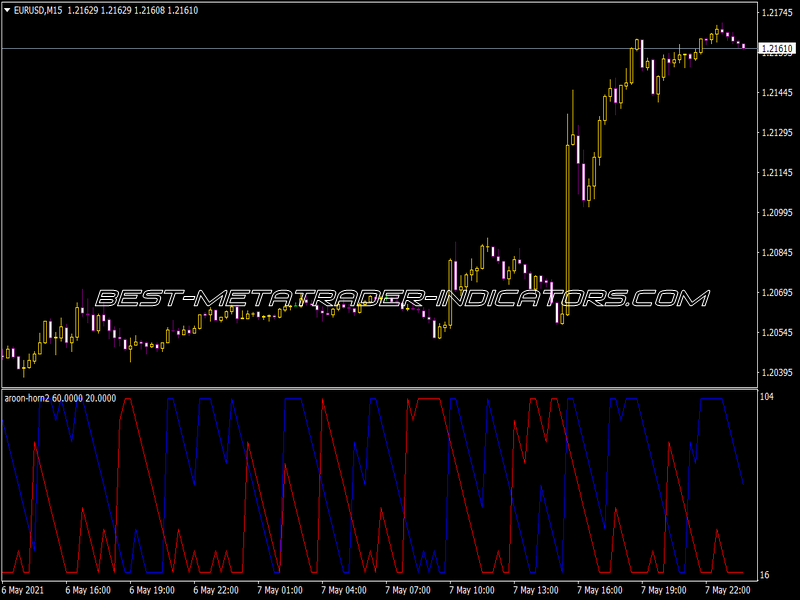
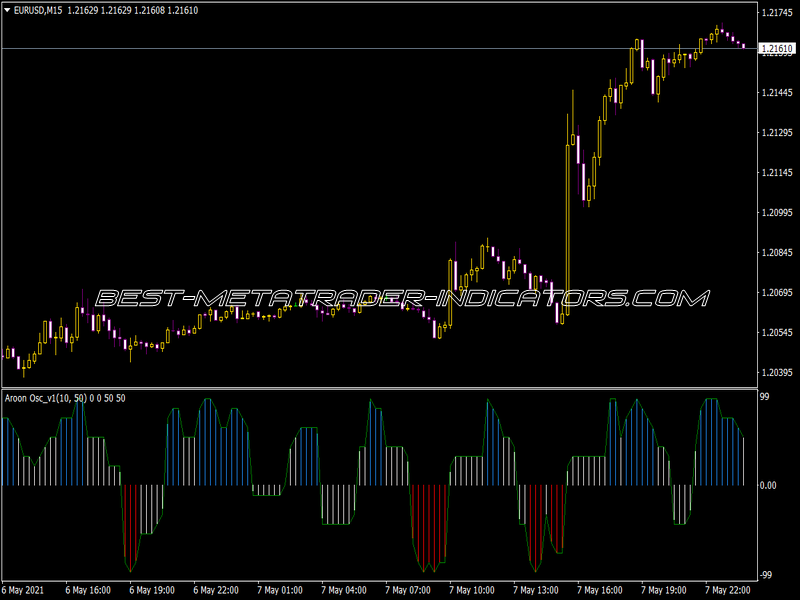
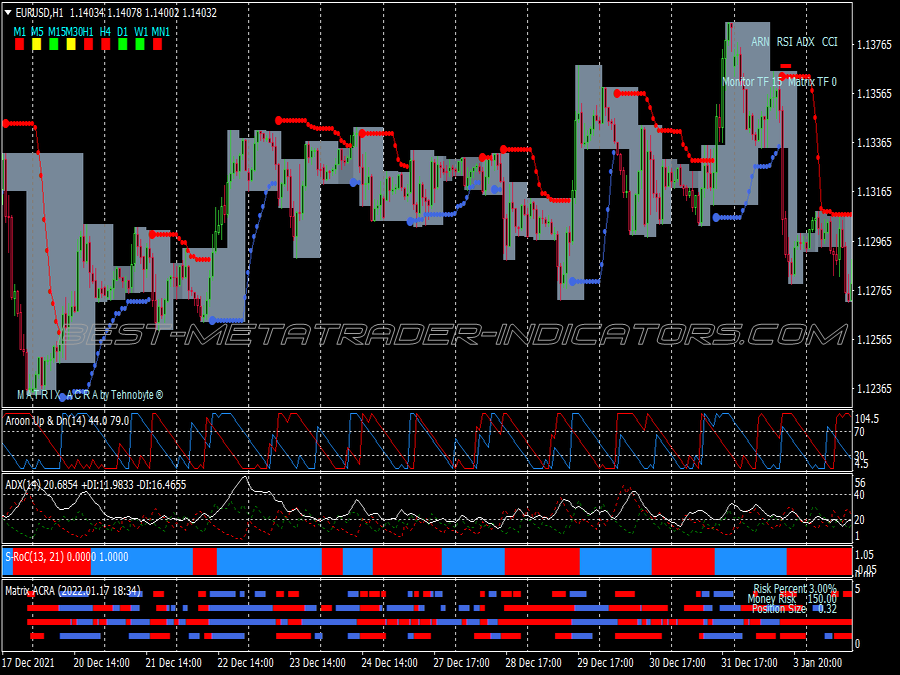
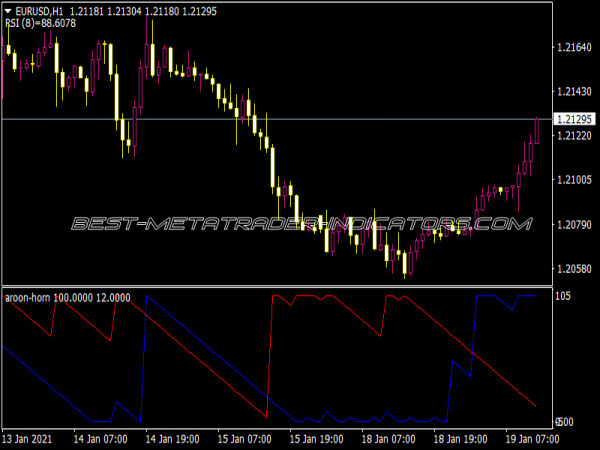
The AROON measures the time component of the trend, namely the number of days that have passed since the last high or low. For example, if you use a 14-day AROON, a new 14-day high with 100 would be displayed (by the AROON-up) and a new 14-day low by the AROON-down. The crossovers of the two AROON lines signal a change in trend.
Since it does not measure the strength of the trend, but the number of days, the rise of the AROON means a continuous trend movement. Trendless phases, on the other hand, are shown by the fact that neither of the two lines is in the upper range. Due to the straightforwardness of the indicator and the other component it measures, it is a good complement to the other trend indicators.
However, it should be borne in mind that small but steady price movements are treated as well as strong price movements, which is why he cannot stand on his own. A trend can usually only be displayed when one of the two indicators rises above 90. The other indicator, which is as below, gives good signals for trend following systems and also trades against the trend. Its strengths are also manifested in sideways movements, where there are much fewer false signals than in other trend indicators.
