Submit your review | |
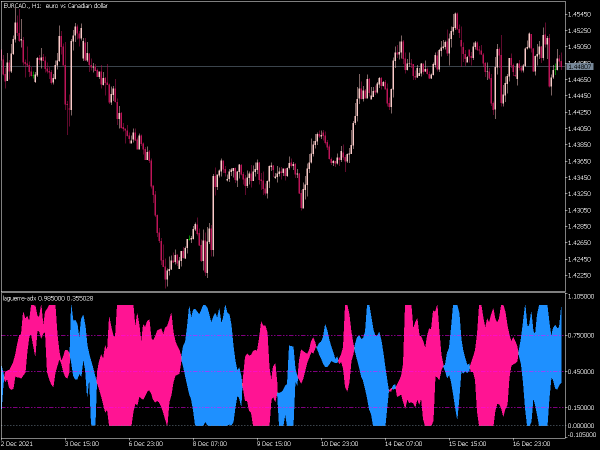
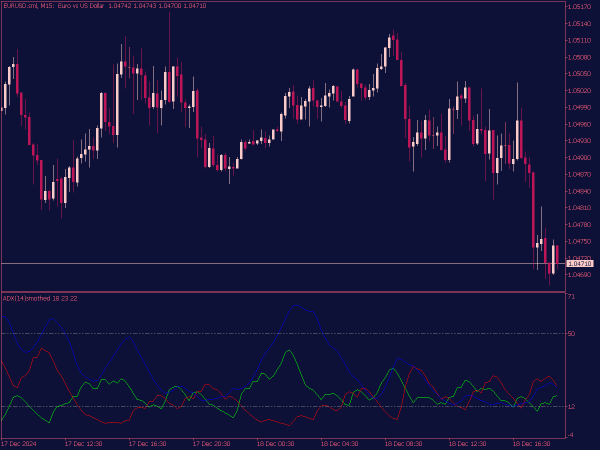
The Average Directional Index (ADX) is a technical analysis indicator used to quantify the strength of a trend in a financial market, regardless of its direction. Developed by J. Welles Wilder Jr., the ADX is derived from the two directional movement indicators, the Positive Directional Indicator (+DI) and the Negative Directional Indicator (−DI). The ADX itself is a smoothed moving average of the absolute value of the difference between +DI and −DI.
Typically displayed as a line that ranges from 0 to 100, the ADX helps traders identify whether a market is trending or consolidating. Values below 20 often indicate a weak trend or sideways movement, while values above 20 suggest a strengthening trend, with readings above 40 indicating a very strong trend.
Importantly, the ADX does not specify trend direction; traders often use it alongside +DI and −DI to determine whether to take long or short positions. While it can be a valuable tool for assessing market strength, it is most effective when combined with other indicators to enhance trading strategies and risk management.
1. Trend Following Strategy
This strategy focuses on identifying strong trends and riding them for maximum gains.
Buy Signal:
• Wait for the ADX line to cross above 25, indicating a strong trend is in play.
• Ensure that the +DI line crosses above the -DI line. This confirms a bullish trend.
• Enter a buy position once the price pulls back slightly after the +DI crossover, ideally near a key support level or moving average.
Sell Signal:
• Look for the ADX to cross above 25.
• Confirm with the -DI crossing above the +DI line, signaling a bearish trend.
• Enter a sell position on a slight price rally after the -DI crossover, preferably near a resistance level or moving average.
Trade Management:
• Set a stop-loss just below the recent swing low for buy trades and above the recent swing high for sell trades. Consider trailing stops to maximize profits as the trend develops.
2. ADX Range Trading Strategy
This strategy is applicable in low volatility environments when the ADX is below 20, suggesting a ranging market.
Buy Signal:
• Identify a support level where the price repeatedly bounces back.
• Confirm that the ADX is below 20, indicating low trend strength.
• Enter a buy position when the price touches the support level and shows signs of upward momentum (e.g., bullish candlestick pattern).
Sell Signal:
• Locate a resistance level where the price frequently pulls back.
• Ensure the ADX is below 20.
• Enter a sell position when the price encounters resistance and forms a bearish candlestick pattern.
Trade Management:
• Set a stop-loss just outside the support or resistance levels to protect against breakout scenarios. Use profit targets that align with the range’s width.
3. ADX Reversal Strategy
This strategy aims to capitalize on potential trend reversals using the ADX to confirm market conditions.
Buy Signal:
• Identify a significant trend with a high ADX value above 25.
• Watch for divergences; for example, if the price is making lower lows while the ADX is rising, it may be a sign of a potential reversal to the upside.
• Enter a buy position when a bullish reversal pattern (e.g., double bottom) emerges after the divergence is confirmed.
Sell Signal:
• Look for a strong downtrend with the ADX above 25.
• Monitor for divergence, where the price is making higher highs while the ADX is decreasing, indicating weakening momentum.
• Enter a sell position on the formation of a bearish reversal pattern (e.g., double top) following the divergence confirmation.
Trade Management:
• Use tighter stop-loss placements due to the inherent risks involved in reversal trades. Consider scaling out of the position if the price moves favorably to lock in profits.
4. ADX Trend Continuation Strategy
This strategy is suitable for capturing the momentum of ongoing trends, particularly after market pullbacks.
Buy Signal:
• Confirm that the ADX is above 25, showcasing a strong bullish trend.
• Wait for a price pullback to a support level or a moving average.
• Enter a buy position when the price shows a rejection of the support level (e.g., bullish candlestick formation).
Sell Signal:
• Ensure the ADX is above 25, confirming a bearish trend.
• Look for a retracement to a resistance level or moving average.
• Enter a sell position when the price exhibits a failure to uphold the resistance (e.g., bearish candlestick pattern).
Trade Management:
• Utilize a stop-loss slightly below the support level for buy trades and just above the resistance level for sell trades. Employ longer-term profit targets, aligning with the prevailing trend.
5. ADX with Other Indicators
Combining the ADX with other indicators can provide a more comprehensive trading strategy.
Buy Signal with RSI:
• Ensure ADX is above 25.
• Confirm that the RSI (Relative Strength Index) is below 30, indicating potential oversold conditions.
• Enter a buy position when both conditions align and a bullish setup emerges (e.g., bullish engulfing candlestick).
Sell Signal with MACD:
• Verify that the ADX is above 25.
• Look for a bearish crossover on the MACD (Moving Average Convergence Divergence).
• Enter a sell position when both indicators signal a continuation of the bearish trend.
Trade Management:
• Adjust stop-loss and take-profit levels according to the volatility indicated by the ADX and use trailing stops to manage risk dynamically as momentum builds.
Conclusion
Incorporating the ADX into your trading strategy provides essential insights into market trends and their strengths. Whether you prefer trend-following, range trading, reversal strategies, or a combination of indicators, the ADX can help refine your entry points and overall decision-making.
As always, practice these strategies in a demo environment before employing them with real capital, and consistently review and adapt your approach based on performance and market conditions. Happy trading!
Average Directional Index (ADX) is a widely used indicator for technical analysts. ADX was developed by J. Welles Wilder in 1978. The main objective of ADX is to indicate the strength of a trend in a market instrument. This indicator does not say if the trend is bullish or bearish neither does it say if the current pair is overbought or oversold it just simply tells the strength of a trend.
ADX is a lagging indicator which means a trend must have established itself before the ADX will generate a signal that a trend is underway. ADX ranges between 0 and 100. Generally, if ADX is below 20 then we can say current trend is weak, and if the ADX is above 40 then we can say trend is strong. And we can say trend is extremely strong when ADX is above 50.
