Submit your review | |
The Auto Trendline Indicator is a powerful tool used by traders to identify important support and resistance levels in the market. Here’s a comprehensive guide on how to effectively trade using the Auto Trendline Indicator.
1. Understanding the Indicator: The Auto Trendline Indicator automatically draws trendlines based on historical price data, helping traders visualize bullish and bearish markets. It identifies significant highs and lows, allowing you to see where the market may reverse or continue its trend.
2. Setting Up the Indicator: First, integrate the Auto Trendline Indicator into your MT4 trading platform. Adjust the sensitivity settings depending on your trading style (short-term traders might prefer a more sensitive setting, while long-term traders might want to look at a broader time frame).
3. Identifying Trend Direction: Before executing any trades, assess the overall trend direction indicated by the trendlines. An uptrend is characterized by higher highs and higher lows, whereas a downtrend shows lower highs and lower lows. Align your trades with the prevailing trend for better success rates.
4. Entry Points: Look for entry points at or near the trendlines. For example, in an uptrend, consider buying when the price retraces to an upward trendline and shows bullish price action signals (like candlestick patterns or divergence). Conversely, in a downtrend, consider selling near the downward trendline.
5. Confirmation Signals: Always seek additional confirmation before entering a trade. This could include other technical indicators (like RSI or MACD), candlestick patterns (such as pin bars or engulfing patterns), or fundamental analysis. Combining these tools can improve your chances of a successful trade.
6. Setting Stop Loss and Take Profit: Always use a stop loss to manage your risk. In an uptrend, place the stop loss below the last swing low, while in a downtrend, place it above the last swing high. For take-profit levels, consider Fibonacci retracement levels or recent highs/lows as potential targets.
7. Managing Trades: Once a trade is active, monitor it closely. If the price approaches the trendline and shows signs of reversal, consider adjusting your stop loss to breakeven or closing part of your position to lock in profits.
8. Avoiding False Signals: Be cautious of false breakouts, where price briefly moves through a trendline before reversing. One way to filter these out is to wait for additional confirmation, such as a close above or below the trendline or further price action that corroborates the direction.
9. Using Multiple Time Frames: Analyze trendlines across multiple time frames. A strong trendline on a higher time frame can often provide more significant support or resistance than one on a lower time frame. Always consider the bigger picture.
10. Integration with Other Strategies: The Auto Trendline Indicator can be effectively integrated with other trading strategies. It can complement various approaches, including breakout trading, retracement trading, or even scalping when used with shorter time frames.
11. Practice and Adaptability: Before deploying your strategy with real capital, practice using a demo account. Get comfortable with the Auto Trendline Indicator and develop your own nuances on how the indicator works with your trading style. Adapt your approach based on market conditions and results.
12. Review and Refine: After a series of trades, review your performance. Analyze winning and losing trades. Look at what worked, what didn’t, and adjust your strategy accordingly. Continuous improvement is key in trading.
In summary, the Auto Trendline Indicator can be a valuable asset in your trading toolkit when used correctly. It’s essential to understand the underlying market mechanics, use confirmation signals, manage risks effectively, and continuously learn and adapt your trading approach. With these steps, you can harness the power of the Auto Trendline Indicator to enhance your trading results.
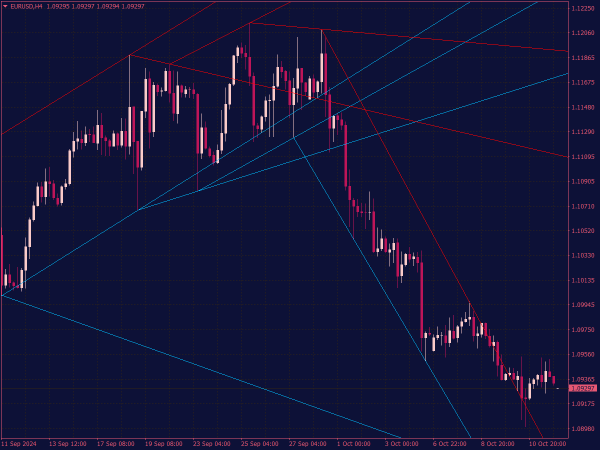
This indicator automatically identifies trend lines on any chart and timeframes, and allows the trader to control the strength of the trend lines.
📌 More Great Indicators and Trading Systems for MT4 or MT5
- Best-Rated MetaTrader Indicators
- Trendline Indicator

- Auto Pivot Plotter Weekly Levels

- Instantaneous Trendline Filter…

- Auto Envelope Indicator

- Auto Stop Revers Indicator

- Demark Trendline Trader Indicator

- Sharp Auto Pivot Indicator

- Auto Pivot Indicator

- Stop Atr Auto Indicator

- Davits Pivot V3 Auto

- Trendline Kill Trading System

- Auto Pivot V2 Indicator

- Trendline Probability Histogram

- Another Version Auto Envelope Indicator

- Trendline Filter Scalping System

- MZZ Trendline SR

- All Stochastic Auto Indicator

- Auto Fibonacci Retracements

- Auto Trend Lines Channels Indicator

- MZZ Trendline

- Non-Repainting and Non-Lagging Indicators