Submit your review | |
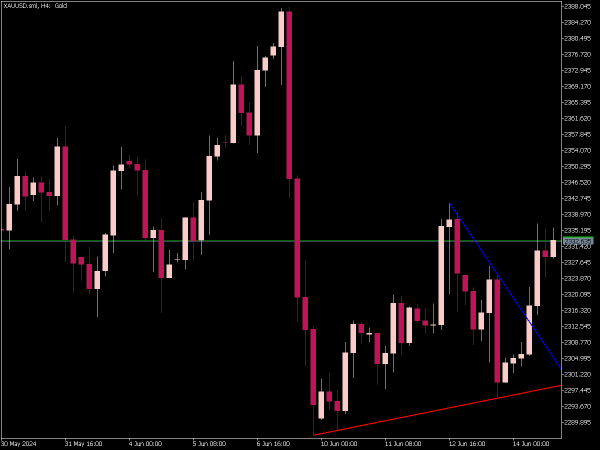
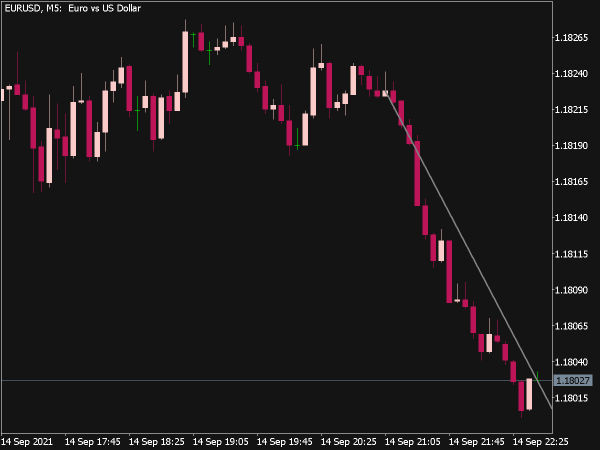
The Auto Trendline Indicator for MetaTrader 5 (MT5) is a tool designed to automatically draw trendlines on price charts based on historical price action. It analyzes market data to identify significant highs and lows, drawing lines that reflect upward or downward trends. Traders use this indicator to help visualize support and resistance levels, enhance trading strategies, and potentially improve entry and exit points.
Traders can customize parameters such as sensitivity and color to tailor the indicator to their preferences. As with any technical tool, it's essential to combine its insights with other analytical methods for effective trading.
Below are several trading strategies that incorporate this indicator:
1. Trend Confirmation: Use the Auto Trendline to confirm the direction of an existing trend before entering trades. Buy when prices are above the upward trendline and sell when below the downward trendline.
2. Breakout Trading: Monitor trendlines for breakouts. When the price breaks above a downward trendline, it signals a potential buy. Conversely, a break below an upward trendline can indicate a sell signal.
3. Pullback Trading: After a breakout, wait for the price to retrace to the trendline. If the price bounces off the trendline, this can provide a good entry point for a long trade in an uptrend or a short trade in a downtrend.
4. Multiple Time Frame Analysis: Check trendlines on higher time frames (e.g., H4 or Daily) for stronger signals and then refine your entry on lower time frames (e.g., M15 or M30) to optimize entries and exits.
5. Divergence Strategy: Use the Auto Trendline in conjunction with oscillators like RSI or MACD to find divergence. If the price makes a new high but the oscillator does not, it could indicate a trend reversal.
6. Trendline Confluence: Look for instances where multiple trendlines from different time frames converge. This confluence can serve as a strong level of support or resistance, providing high-probability entry points.
7. Risk Management: Incorporate trendlines into your risk management strategy by placing stop losses just below recent swing lows in an uptrend or above swing highs in a downtrend to minimize losses.
8. Exit Strategy: Use the trendlines to set profit targets. A common practice is to aim for a risk-reward ratio of at least 1:2, with exits at the next significant trendline.
9. Reversal Trading: Identify potential reversal areas due to trendline interactions. If the price approaches a long-term trendline and shows signs of reversal (e.g., candlestick patterns), consider entering a trade.
10. Automated Alerts: Set up alerts for when the price approaches or breaks through trendlines. This will allow you to react quickly to trading opportunities without constant monitoring.
By integrating the Auto Trendline Indicator into your MT5 trading strategies, you can enhance your decision-making process and improve the overall efficiency of your trading.
