Submit your review | |
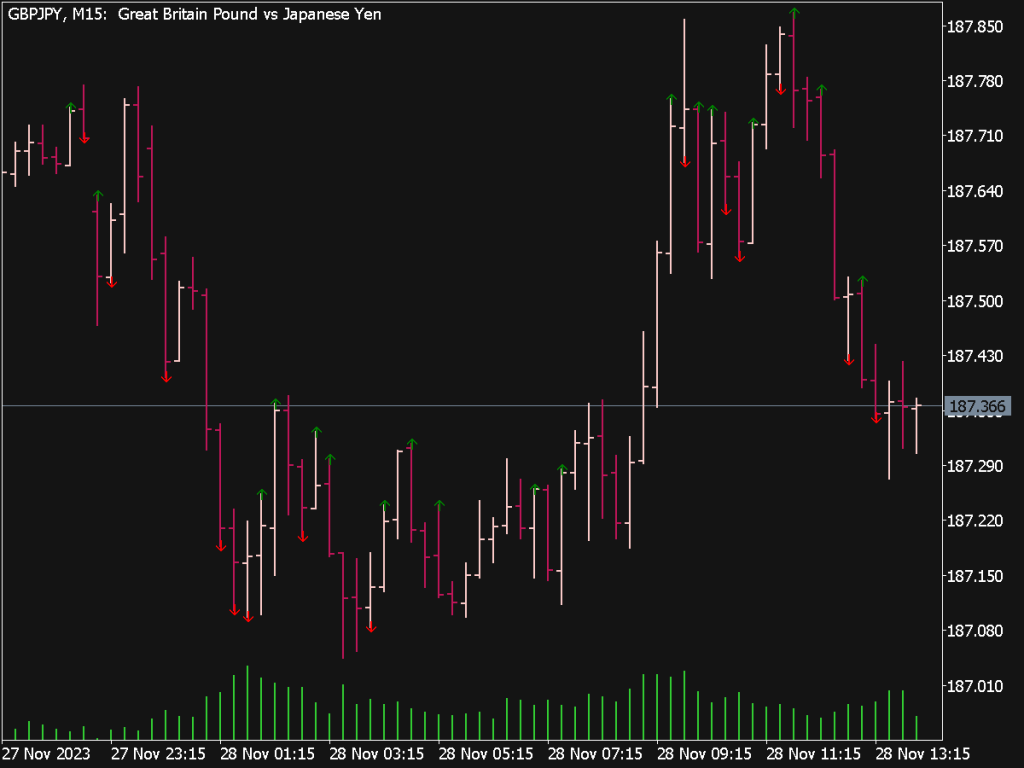
The Price Volume Divergence Indicator (PVDI) is a powerful tool for traders looking to identify potential reversals or continuations in price trends by analyzing the relationship between price movements and trading volume. Understanding how to effectively use PVDI involves several strategies and tips that can enhance trading decisions.
1. Understanding the Basics: The Price Volume Divergence indicator measures the correlation between price trends and volume changes. A divergence occurs when price moves in one direction while volume moves in the opposite direction. For example, if prices are increasing but volume is decreasing, this might indicate weakening momentum and a potential reversal.
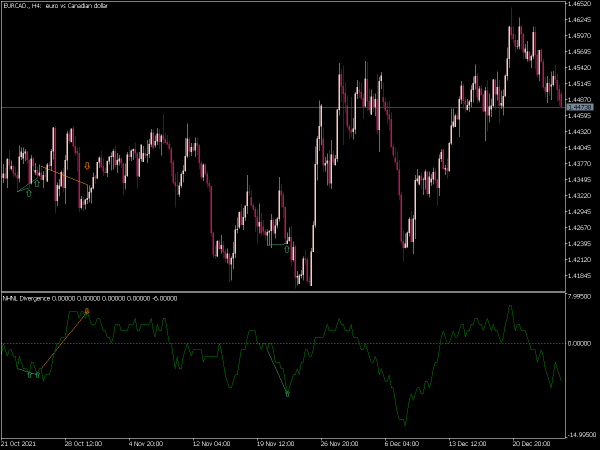
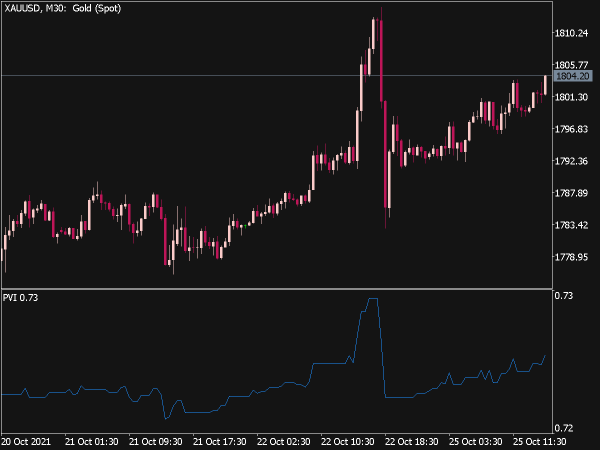
2. Identifying Divergence: To spot divergence, traders should first plot the PVDI alongside their price chart. Look for instances where the price makes a higher high (or lower low) while the PVDI does not follow suit (making lower highs or higher lows, respectively). This divergence can signal that the current trend is losing strength.
3. Confirming Signals: It’s essential to use the PVDI in conjunction with other technical indicators for confirmation. Common pairings include the Relative Strength Index (RSI) to check for overbought or oversold conditions, or candlestick patterns for further validation of potential trend reversals.
4. Time Frame Selection: The effectiveness of the PVDI can vary across different time frames. Shorter time frames may yield more frequent signals but can also lead to false positives due to market noise. Therefore, many traders prefer to use PVDI on longer time frames (daily or weekly charts) for more reliable signals, especially when they align with major support and resistance levels.
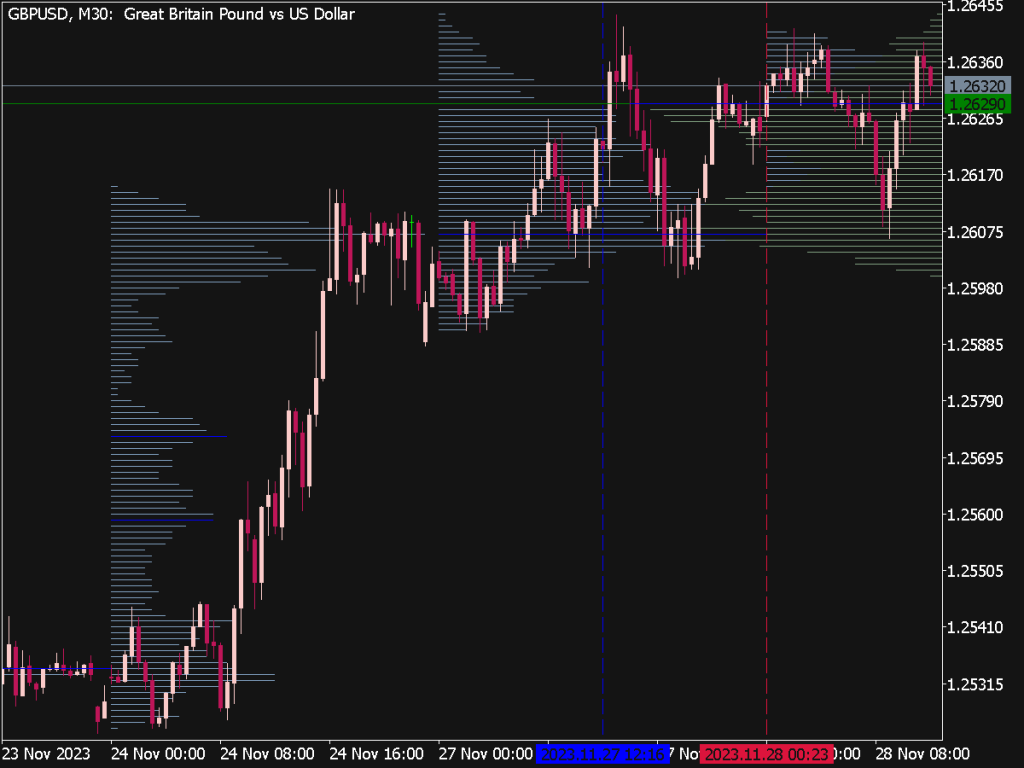
5. Volume Patterns: Pay attention to the overall volume trends. Increasing volume can confirm a strong trend, whereas decreasing volume during a price increase might suggest that traders are losing interest, which can foreshadow a reversal. Also, consider using volume profile analysis to understand significant price levels.
6. Setting Entry and Exit Points: Once a divergence is identified and confirmed, traders should plan their entry points. Consider entering the market shortly after the price breaks key support or resistance levels that align with the divergence. Profit targets should be based on historical volatility, resistance levels, or Fibonacci retracement levels.
7. Risk Management: Always employ risk management strategies when trading with PVDI. This includes setting stop-loss orders just beyond the divergence point or using average true range (ATR) to determine the distance for your stop-loss placements, depending on the volatility of the asset.
8. Adapting to Market Conditions: Markets can behave differently under various conditions (bullish, bearish, sideways). Adaptive traders modify their strategies according to market conditions. For instance, in a strong trending market, it might be prudent to extend your divergence identification and rely more on volume for continuation signals rather than reversals.
9. Combining with Fundamental Analysis: While PVDI is primarily a technical indicator, incorporating fundamental analysis can provide a broader perspective on market conditions. News events, earnings reports, or macroeconomic data releases can significantly affect price behavior and volume, potentially leading to stronger or weaker divergences.
10. Backtesting Strategies: Before implementing strategies based on the PVDI in real trading, it is essential to backtest them using historical data. This process helps traders understand the effectiveness of the PVDI in various market conditions and adjust their strategies accordingly.
11. Emotional Discipline: Trading based on indicators can be emotionally challenging, especially when facing losses. Maintain emotional discipline by adhering to your trading plan and risk management strategies. Avoid making impulsive decisions based on short-term movements, and instead, focus on long-term outcomes.
12. Continuous Learning and Adaptation: The markets are constantly evolving, and so should your trading strategies. Continuously educate yourself on market developments, new tools, and advanced trading techniques. Adapt your use of the PVDI as necessary and stay open to refining your methodology based on ongoing performance and changing market dynamics.
In conclusion, the Price Volume Divergence Indicator is a valuable asset for traders looking to enhance their technical analysis. By recognizing divergences, confirming signals, managing risk, and continuously educating themselves, traders can effectively utilize PVDI to identify potential entry and exit points in their trading strategies, leading to improved trading outcomes.
