Submit your review | |
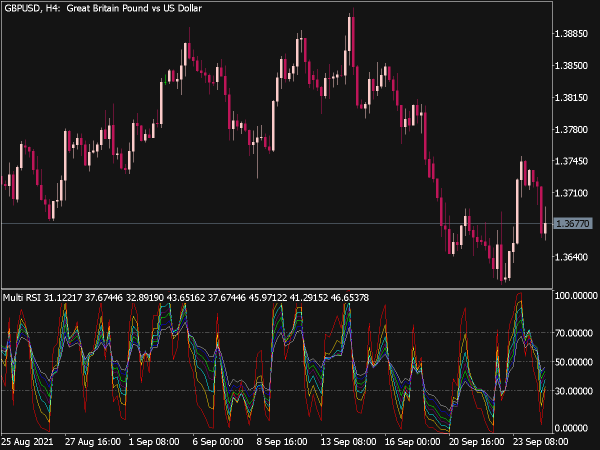
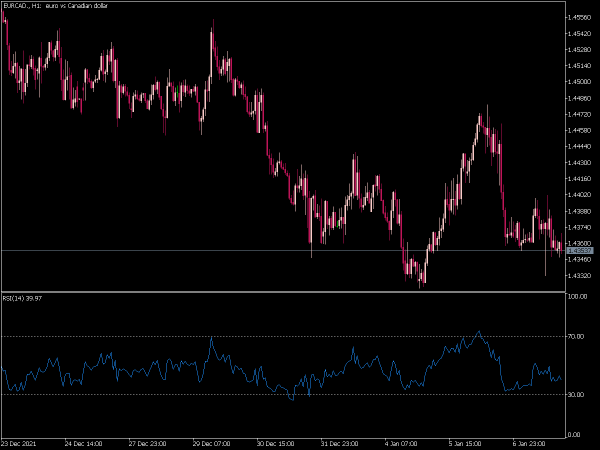
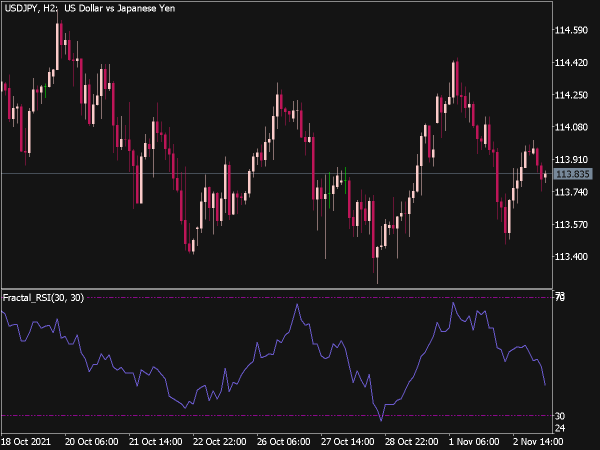
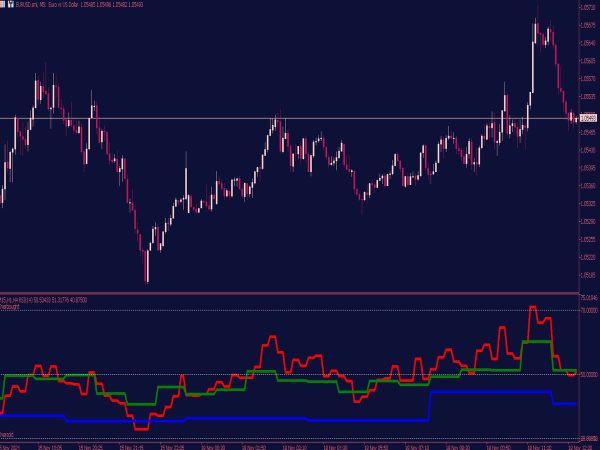
The MTF (Multi-Time Frame) RSI Indicator is a technical analysis tool that combines the RSI, a momentum oscillator measuring the speed and change of price movements, with multiple time frames to provide a broader perspective of market conditions. Traders use this indicator to assess overbought or oversold conditions across different time frames, allowing for more informed trading decisions. By analyzing the RSI from various time frames, traders can identify potential entry and exit points while mitigating the impact of noise from shorter time frames, enhancing the overall accuracy and effectiveness of their trading strategies.
Here are several strategies that can be employed using the MTF RSI indicator:
1. Trend Confirmation: Use the MTF RSI to confirm the prevailing trend. For example, if the daily RSI is above 50 and the weekly RSI also aligns, consider taking long positions. Conversely, if both are below 50, look for short opportunities. This approach seeks to align trades with the wider market trend.
2. Divergence Trading: Monitor for divergence between price action and the MTF RSI across multiple time frames. For instance, if the price makes a new high but the RSI fails to do so, this negative divergence may suggest a potential reversal. Analyzing divergences on different time frames adds strength to the trading signals.
3. Overbought/Oversold Conditions: Identify overbought (>70) and oversold (<30) conditions on the MTF RSI across various time frames. A multiple time frame approach can provide higher accuracy; for example, if the 4-hour RSI shows overbought while the daily remains neutral, it may signal a pullback.
4. Crossovers Strategy: Utilize RSI crossovers for entry and exit points. When the RSI crosses above 30 (from oversold) on the lower time frame, it could indicate a buying opportunity, especially if the higher time frame trends support it. Similarly, a crossover below 70 from overbought conditions may signal a sell opportunity.
5. Multi-Time Frame Analysis: Conduct a comprehensive analysis using three time frames (e.g., daily, 4-hour, 1-hour). Look for synchronization in RSI readings; for instance, if all time frames indicate bullish momentum, this strengthens the buying case. Ensuring alignment across multiple frames enhances trade reliability.
6. RSI Trendline Breaks: Draw trendlines on the MTF RSI chart and watch for breaks. A bullish breakout above a descending RSI trendline can signal a buying opportunity, while a bearish breakdown of an ascending trendline may indicate a short opportunity. This technique combines traditional technical analysis with RSI insights.
7. Combining with Other Indicators: Use the MTF RSI in conjunction with other indicators, such as moving averages or MACD, to refine entry and exit signals. For example, if the MTF RSI signals an overbought condition coinciding with a moving average cross, it can strengthen the case for a reversal.
8. Setting Stop-Loss and Take-Profit Levels: Incorporate MTF RSI levels into risk management strategies. For instance, if taking a long position based on bullish divergence, set stop-loss orders below significant support levels while targeting previous price resistance levels as take-profits.
9. Scalping: Traders can employ the MTF RSI in short-term trading or scalping by focusing on lower time frames (e.g., 5-minutes or 15-minutes). Look for quick setups based on RSI signals while ensuring that the higher time frame supports the trade direction.
10. Combining with Price Action: Merge the MTF RSI with price action techniques. For instance, if the RSI indicates overbought on a higher time frame, and there’s a bearish candlestick pattern on a lower time frame, it may strengthen the probability of a price decline.
Ultimately, successful trading using the MTF RSI requires a well-rounded approach that includes proper risk management, a solid understanding of market dynamics, and a disciplined trading plan. Testing strategies through backtesting and practicing in a demo environment can help traders fine-tune their skills before applying real capital. As with all trading strategies, it's crucial to remain aware of market conditions and adapt methodologies accordingly.
It should be noted that, despite the name Relative Strength Index, this oscillator has nothing to do with relative strength (RS), which is a very important indicator for stocks, commodities and intermarket analysis. The formula is:
100 – (100 : 1 + (U / D))
Where U is the price change in the uptrend and D is in the downtrend.
With RSI, there are usually several divergences, so that the divergence signals are quite complicated to evaluate here.
Trend lines and formations
Formations are relatively rare here, on the other hand, the trend lines are very important, they can often be drawn sensibly and trend line breakthroughs should always be noted. Also resistance and support zones, in general the whole range of instruments of chart analysis can be used well here. It is particularly important that the RSI has the property that it usually breaks through its trend lines earlier than the prices. This is probably the most important application form for the RSI.
Different variants
Dynamic Momentum is an RSI weighted by the volatility of the last five days. It is from Chande. The interpretation is essentially the same as for the RSI, but the indicator is much faster, so it has the advantage that it often has a lead before the prices and can thus be used favorably to assess possible breakouts.
Sideways movements
One can often predict the breakout from a sideways movement by paying attention to the course of the RSI. If this rises, for example, which means that higher lows form in the course of the sideways movements, the breakout will usually happen upwards. However, if lower highs form in the course of the sideways movement, the breakout will go down.
This is a relatively unknown property of the RSI. The forecast turns radically in the other direction if this formation fails on the basis of a trend line break: for example, suppose that during a sideways movement in the price, the RSI would have formed a sequence of higher highs, which is a bullish signal. If he were to break the trend line below these bottoms down now, the signal would not only be bearish, but strongly bearish.
Remarks
Despite the popularity, it must be said that there are now better oscillators. The RSI is relatively low, as it is slow and wanders around in the midfield for a very long time. So if you want to use it, you should focus on its two strengths:
He gives good formations, especially resistance and support lines, as well as trend lines.
It has a slightly different idea than most other oscillators and is therefore partly suitable to be combined with them, because then the probabilities add up.
The RSI as a long-term indicator
As soon as the RSI falls below 20 on monthly charts, it is an extreme situation that rarely occurs and indicates a bottoming out. In extreme situations, values of 16 or 15 can be achieved. Usually this is followed by a sharp backlash, but the RSI is just not useful for timing.
