Submit your review | |
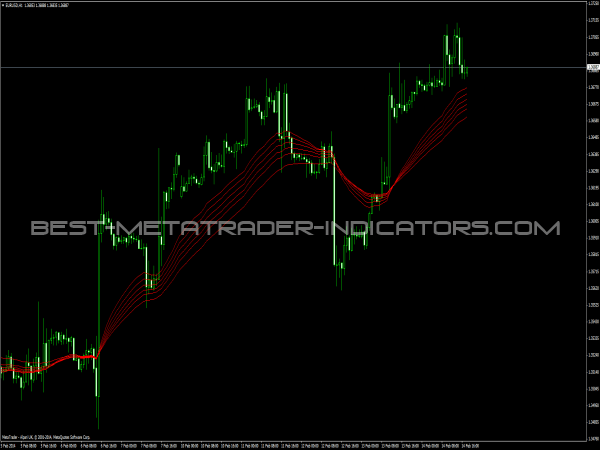
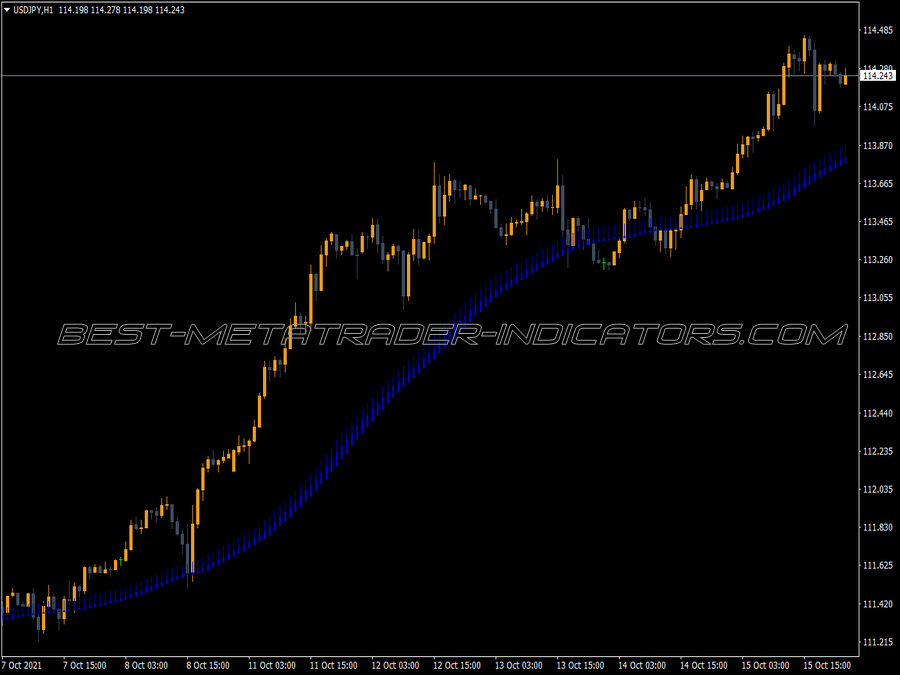
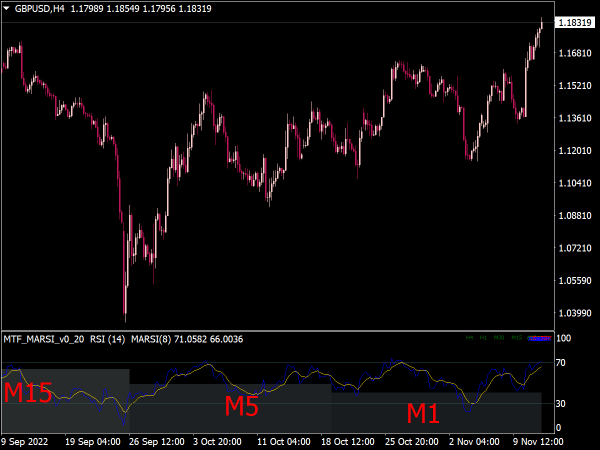
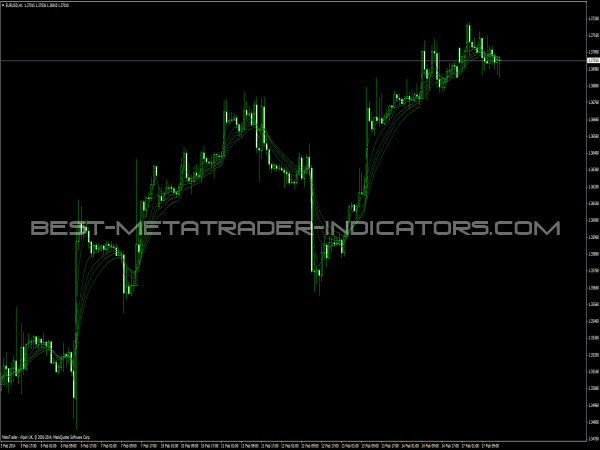
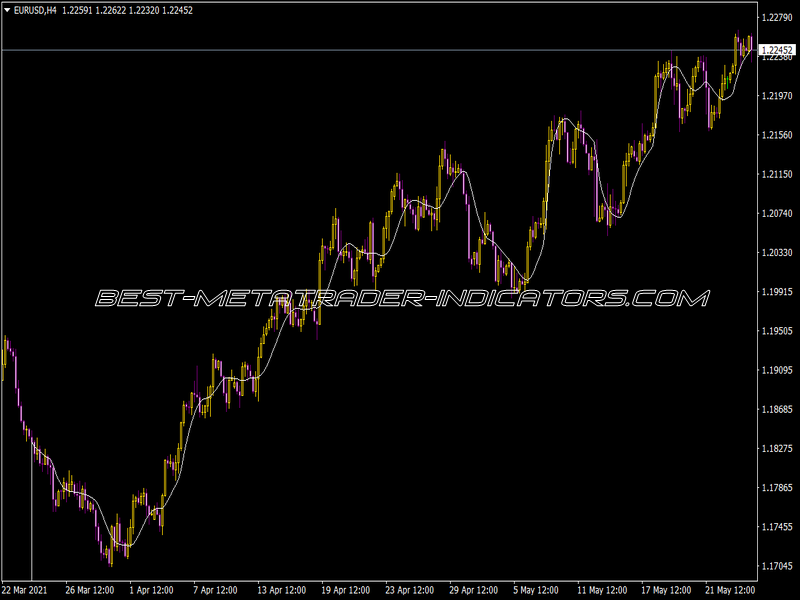
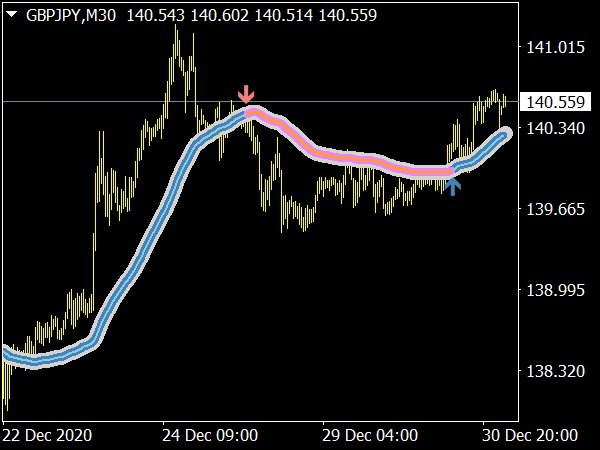
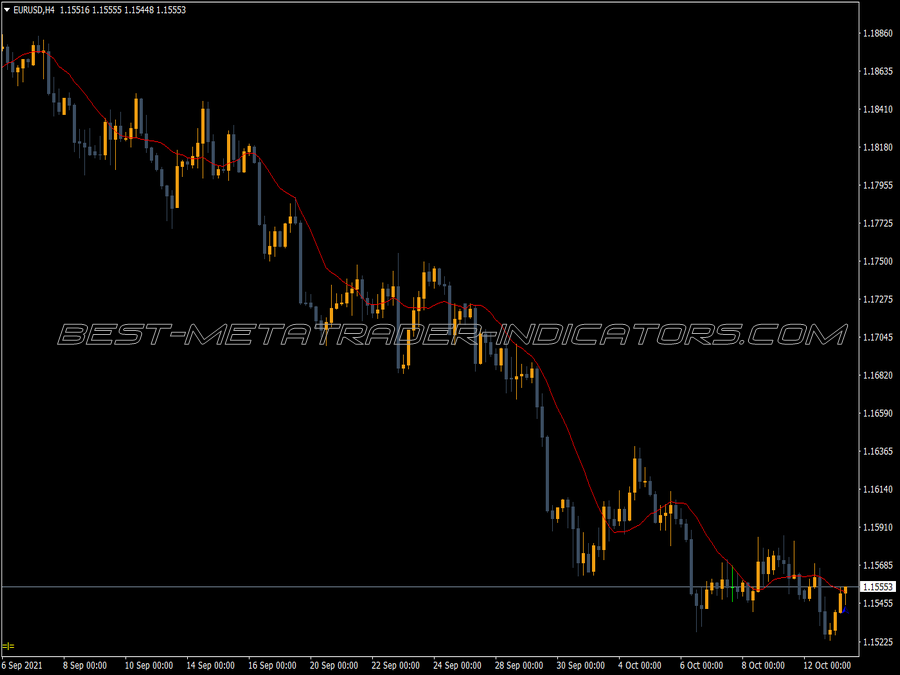
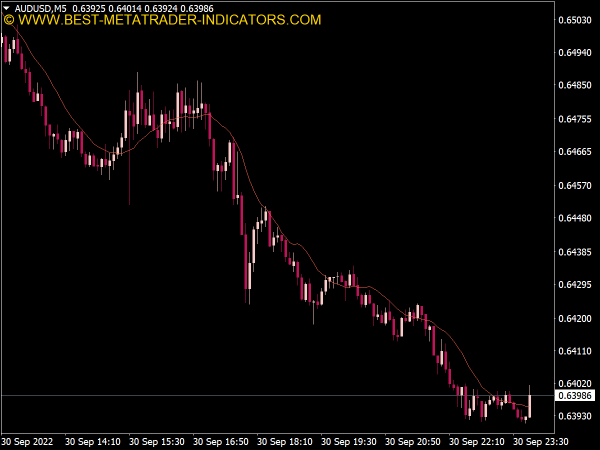
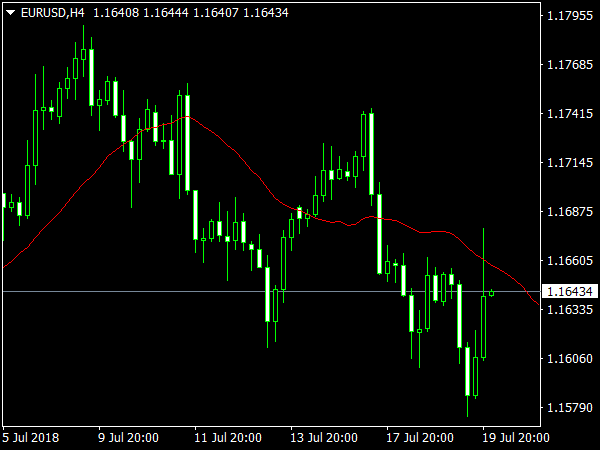
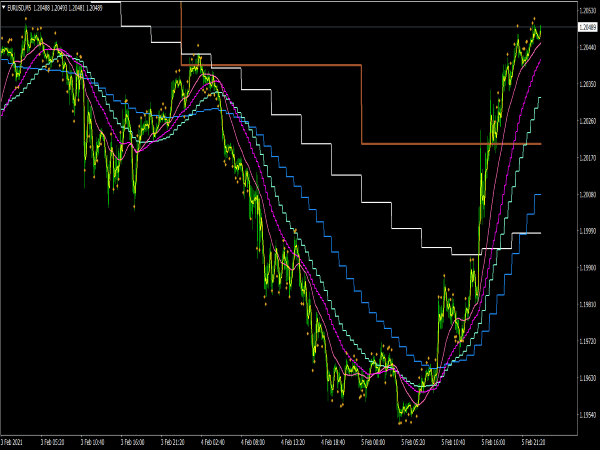
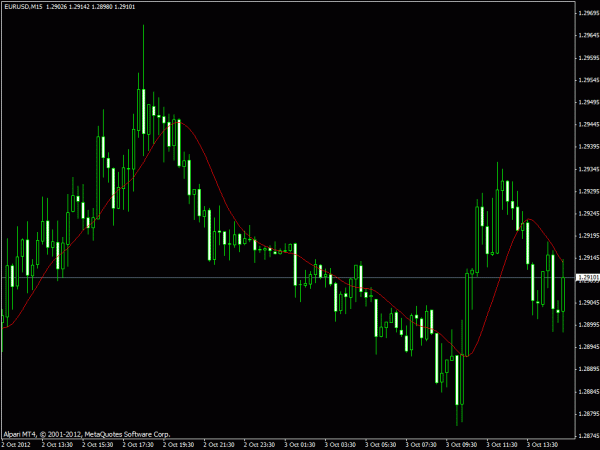
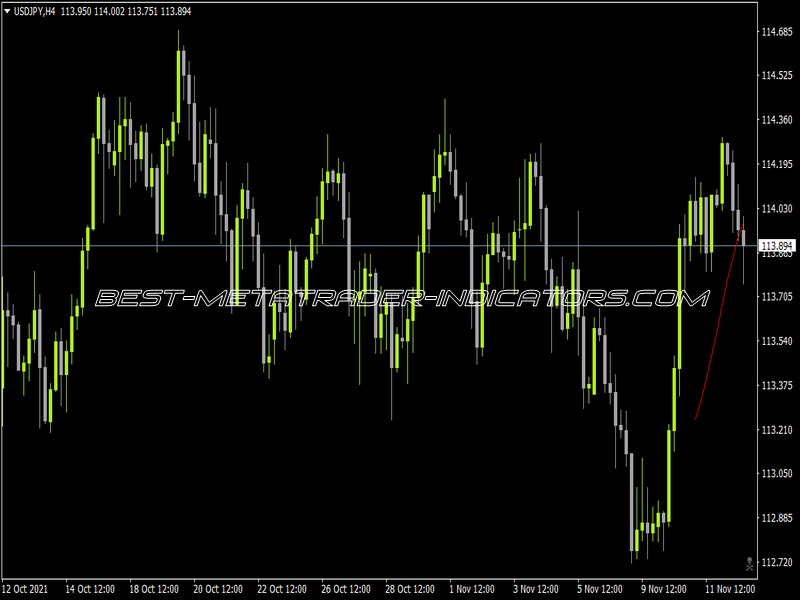
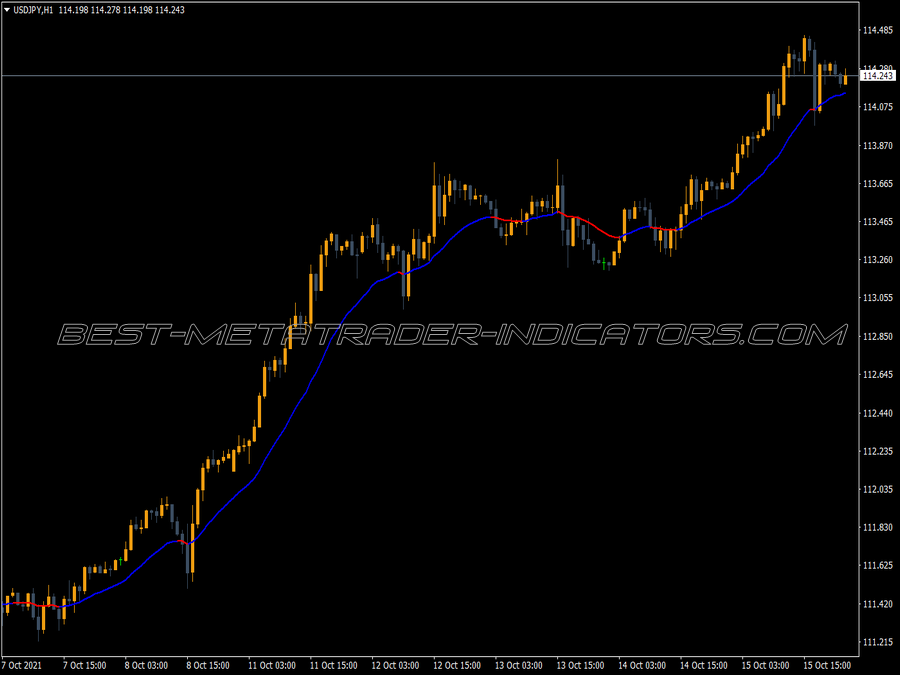
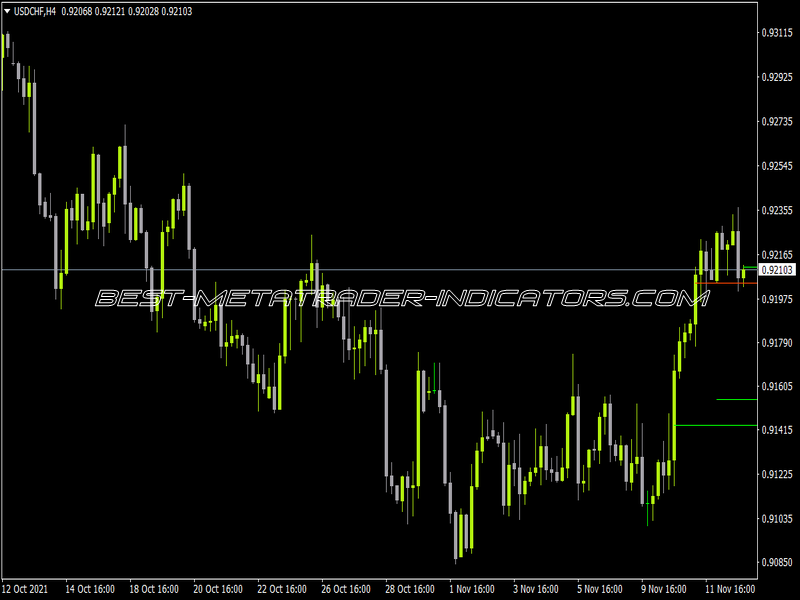
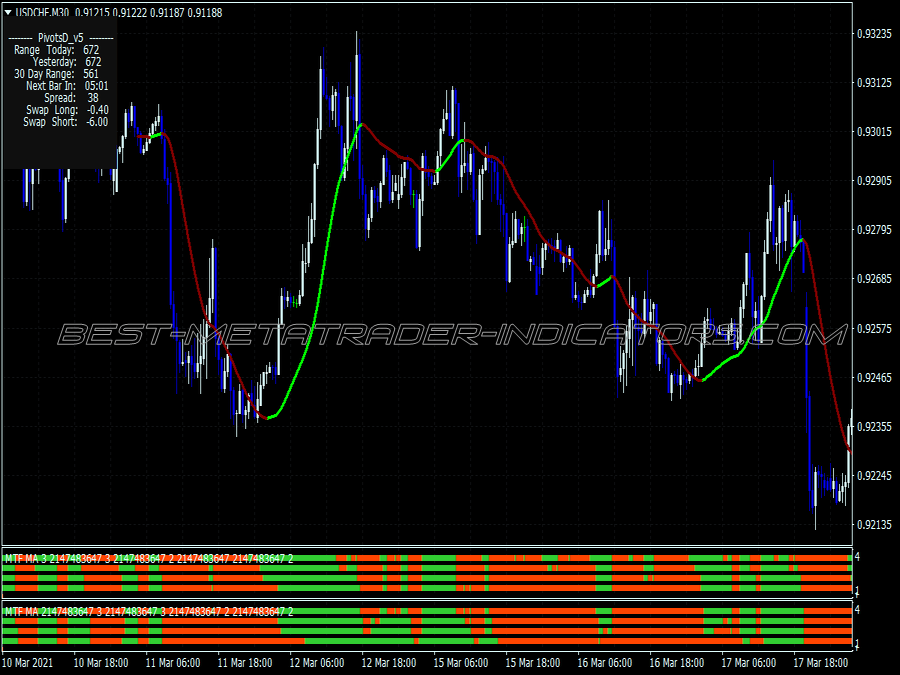
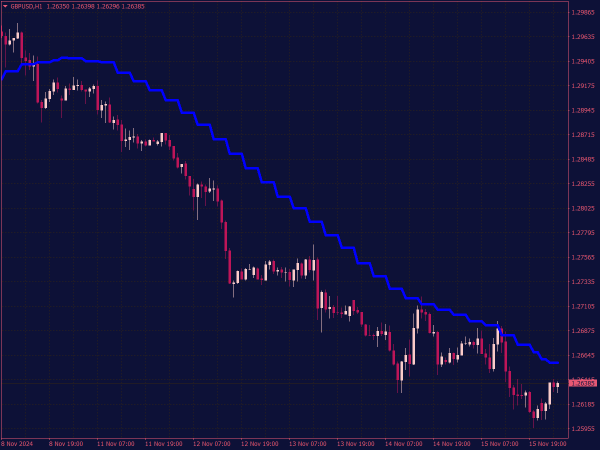
The MTF (Multi-Time Frame) Moving Average Indicator is a technical analysis tool used by traders to analyze price trends across different time frames simultaneously. By displaying moving averages from various time periods (such as daily, weekly, and hourly) on a single chart, it allows for a more comprehensive view of market trends, helping traders make informed decisions based on both short-term and long-term momentum. This indicator can be particularly useful for identifying potential entry and exit points, as well as confirming the overall direction of the market.
Here are several strategies for using the Moving Average MTF Indicator:
1. Trend Following Strategy:
• Use a 200-period MA on a daily chart to determine the long-term trend.
• Switch to a 1-hour chart and enter a buy position when the 50-period MA crosses above the 200-period MA.
• Conversely, enter a sell position when the 50-period MA crosses below the 200-period MA.
2. Crossover Strategy:
• On a 4-hour chart, use a combination of a 20-period and a 50-period MA.
• Enter a long position when the 20-period MA crosses above the 50-period MA.
• Exit when the 20-period MA crosses below the 50-period MA.
3. MTF Convergence Strategy:
• Analyze a daily 100-period MA to determine the prevailing trend.
• Use a 4-hour chart to spot potential reversals.
• Enter a trade when the 20-period MA on the 4-hour chart aligns with the trend indicated by the daily 100-period MA.
4. Moving Average Bounce:
• Identify key support/resistance levels on a daily chart using a 50-period MA.
• If the price bounces off the 50-period MA on the daily chart and shows confirmation (like a rejection candle), consider entering a trade in the direction of the trend.
5. Scalping Strategy:
• On a 15-minute chart, use a combination of short MAs (like 5 and 10 periods).
• Enter buy orders when the 5-period MA crosses above the 10-period MA and sell orders for the reverse crossover.
• Set tight stop-losses and targets to capitalize on small price movements.
6. Filter with Multiple Time Frames:
• Use a 1-hour chart to identify entry points where the price crosses the 50-period MA.
• Confirm trend direction via the 4-hour chart with a 200-period MA; only take trades that align with this higher time-frame trend.
7. Fibonacci and Moving Averages:
• Combine Fibonacci retracement levels with MAs; for instance, look for price to retrace to the 50% Fibonacci level coinciding with the 50-period MA on the 1-hour chart before entering a trade.
8. Daily to Hourly Alignment:
• Identify a bullish or bearish trend on a daily chart using a 100-period MA.
• Zoom into a 1-hour chart for precise entry; look for price breaks and retests of the 50-period MA before entering.
9. News Trading Strategy:
• Monitor moving averages on a 30-minute chart before major news events.
• If the moving averages signal an impending breakout, prepare to enter in the direction of the trend once volatility spikes post-news.
10. MACD Confirmation with MAs:
• Employ the MACD indicator in conjunction with a 50-period MA.
• Enter long when the MACD line crosses above the signal line while confirming a price close above the 50-period MA.
Each strategy can be customized with proper risk management, backtesting, and adaptability to particular assets. Successful traders often calibrate these methods according to their trading style, risk tolerance, and market conditions.
