Submit your review | |
Support and resistance (S&R) levels are essential concepts in technical analysis that traders use to identify potential reversal points in asset prices. In MetaTrader 4 (MT4), various indicators can assist traders in pinpointing these levels, aiding analysis and decision-making. This guide provides an overview of trading rules using the S&R indicator in MT4, along with practical implementation steps.
Understanding Support and Resistance
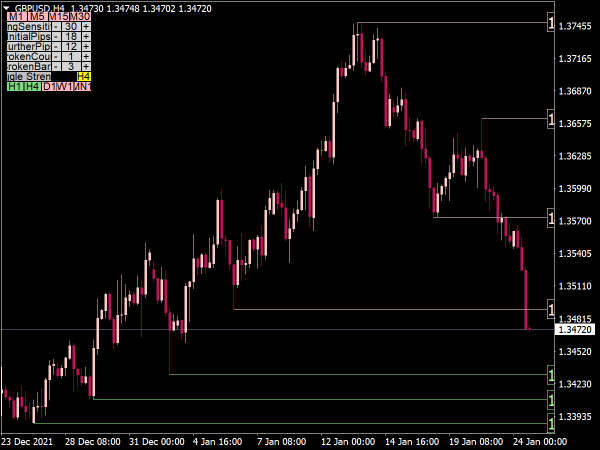
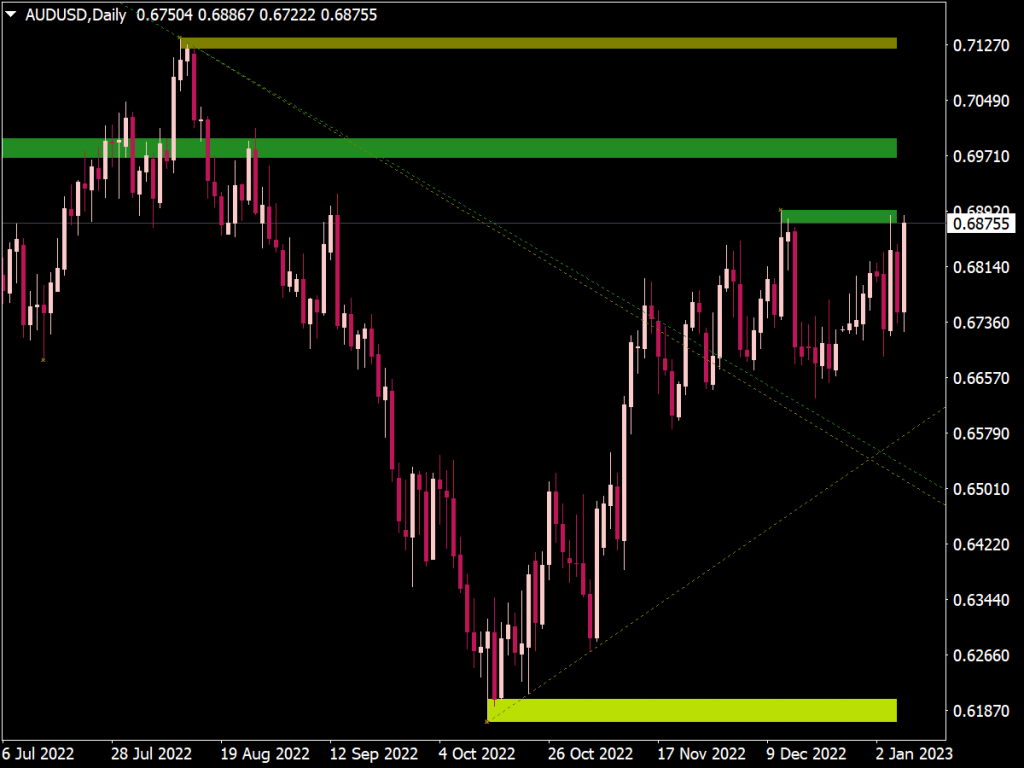
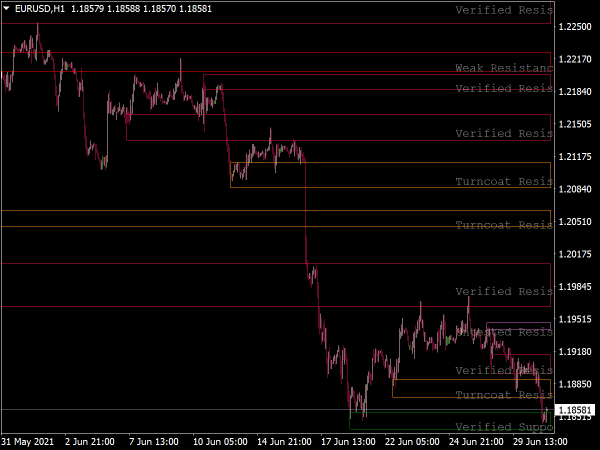
Support is a price level where an asset tends to stop falling and may rebound, while resistance is where the price halts an upward movement. These levels are formed based on historical price action, where prices have previously reversed direction. Recognizing these levels can help traders make informed decisions regarding entry, exit, and stop-loss placement.
Setting Up the MT4 Indicator
1. Download and Install: Locate a reputable S&R indicator compatible with MT4. After downloading, place the indicator file in the “Indicators” folder of your MT4 directory, then restart the platform.
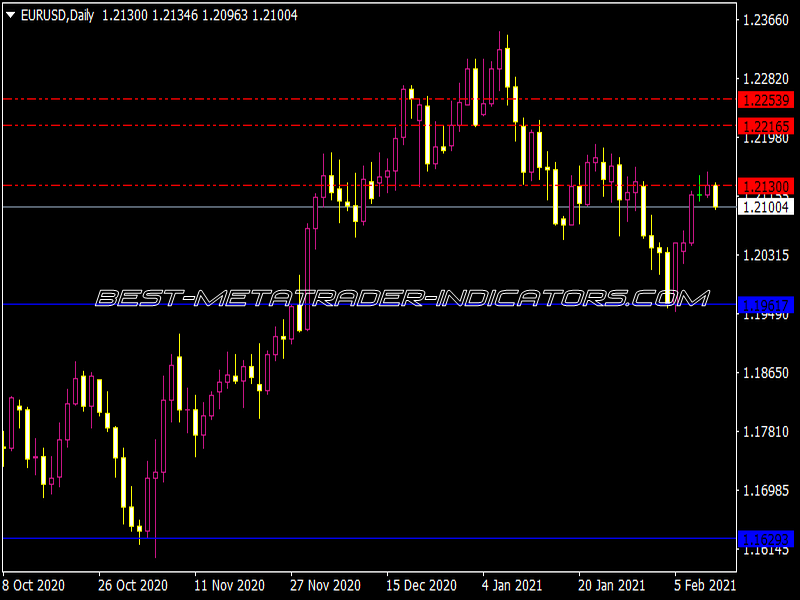
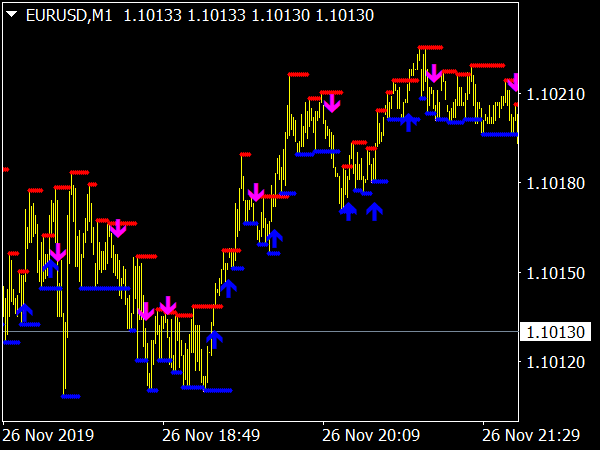
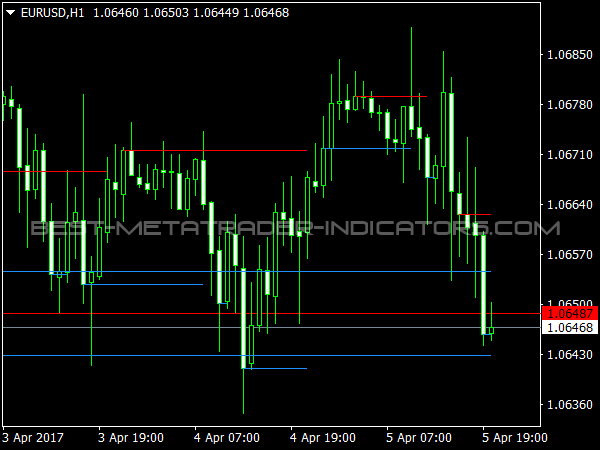
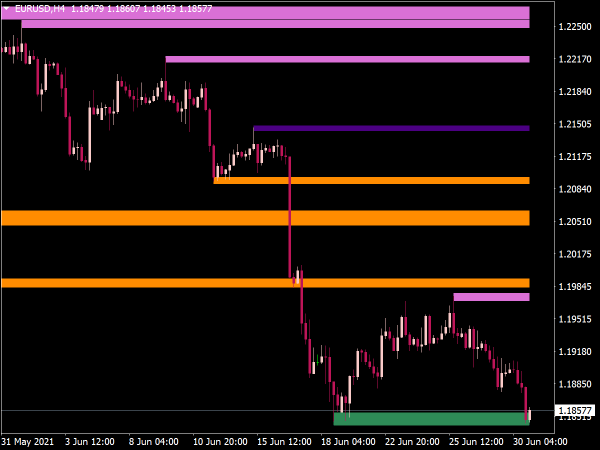
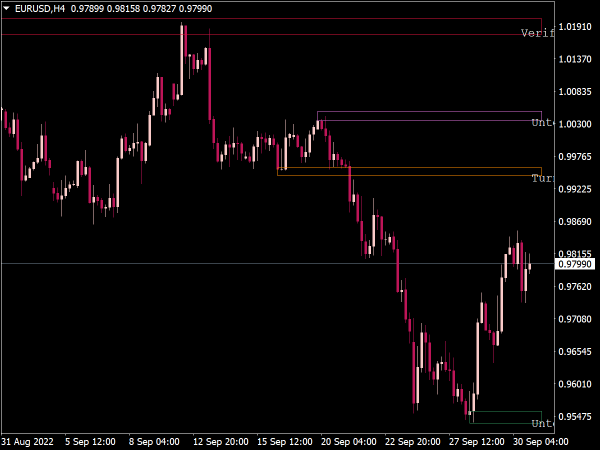
2. Apply the Indicator: Open a chart of the asset you wish to analyze. Click on "Insert" > "Indicators" > "Custom" > and select your S&R indicator. The indicator will mark key levels on your chart.
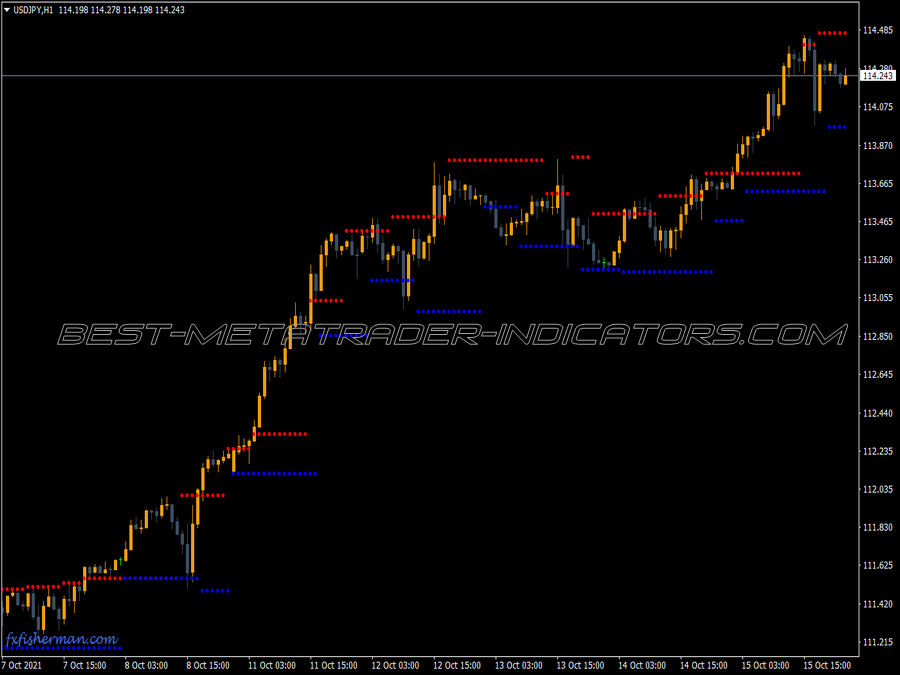
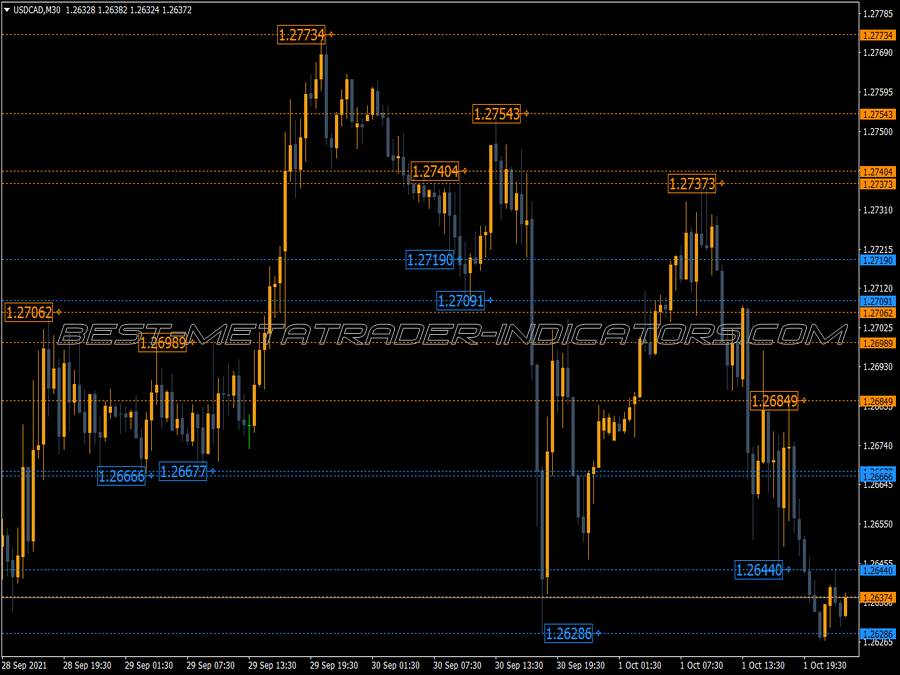
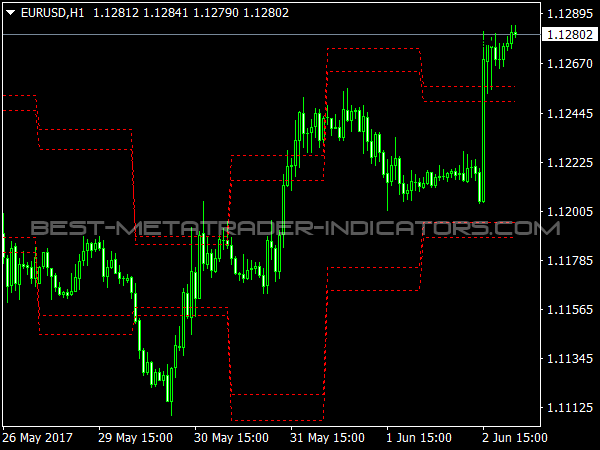
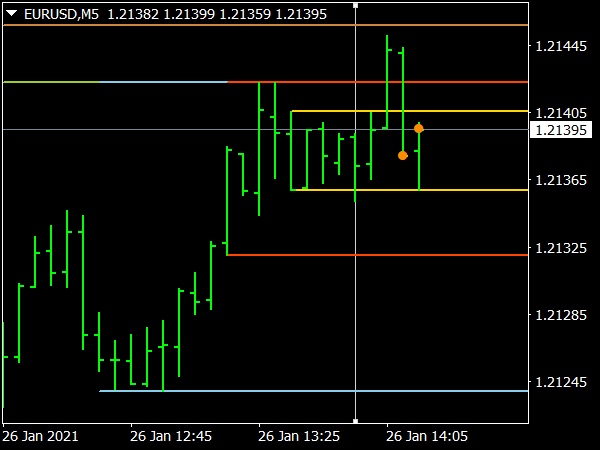
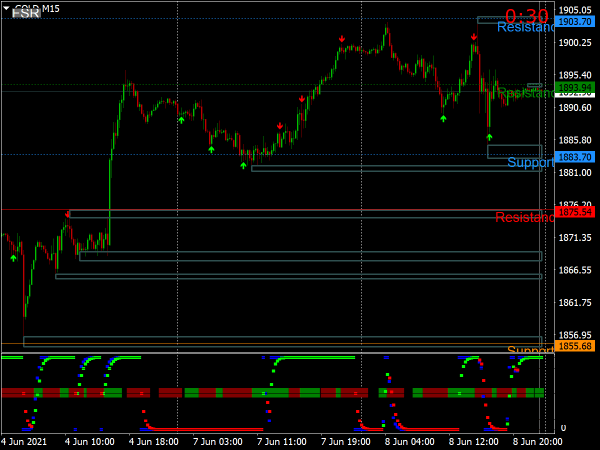
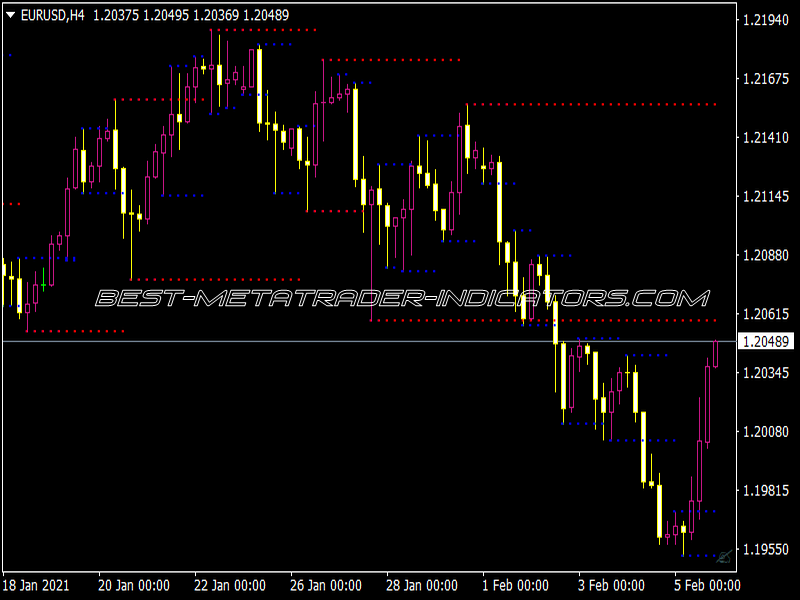
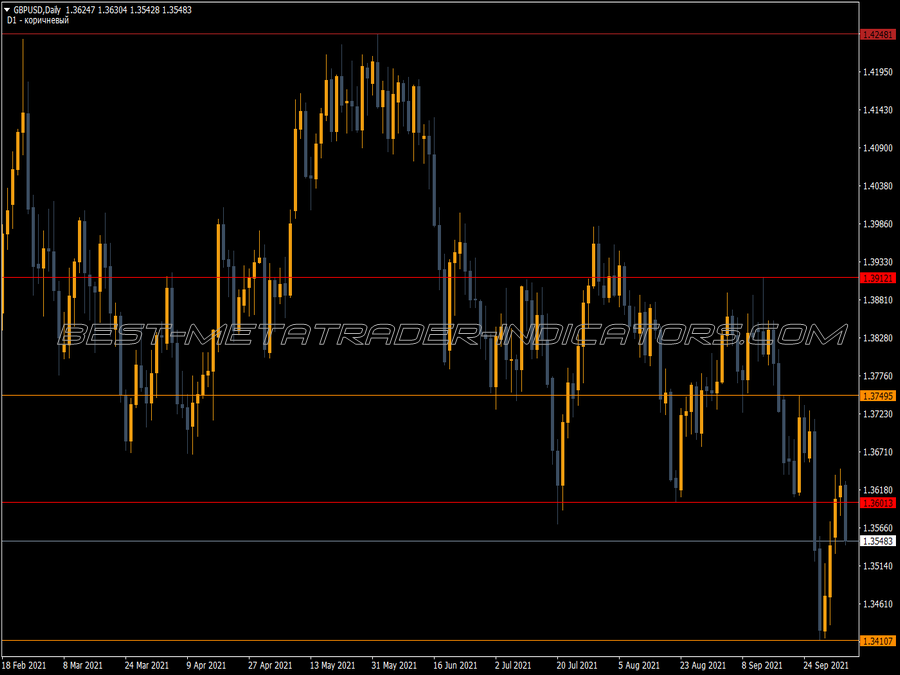
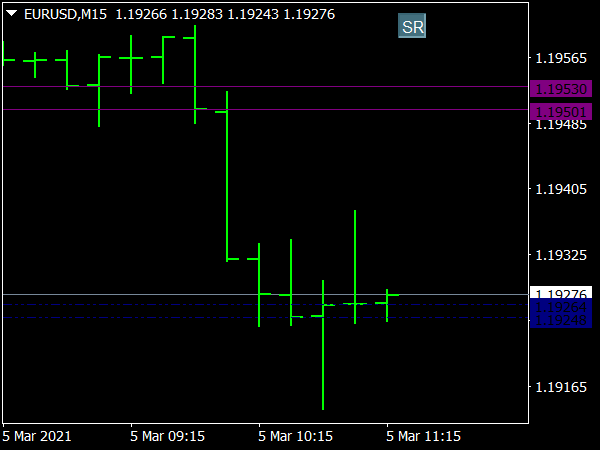
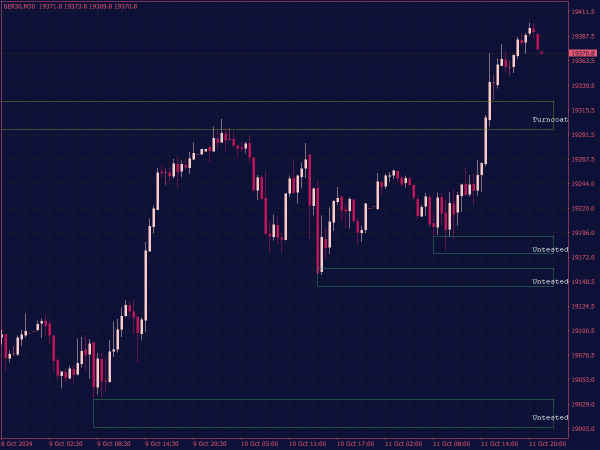
3. Understand the Signals: Most S&R indicators will plot horizontal lines on your chart, indicating potential support and resistance areas. Familiarize yourself with how these levels are derived; some indicators may utilize recent highs/lows, Fibonacci retracements, or pivot points.
Trading Rules Using Support and Resistance
1. Identifying Key Levels
Long-term vs. Short-term: Identify both short-term and long-term S&R levels, as they can yield different trade setups. Longer time frames, such as daily or weekly charts, provide stronger levels than shorter time frames.
2. Confirmation with Price Action
Look for price action signals, such as pin bars or engulfing candles, near established S&R levels. These patterns can help reinforce the strength of the support or resistance.
3. Entering Trades
For Long Trades: Consider entering a buy position when the price approaches a support level and shows bullish reversal patterns, with a stop-loss placed slightly below the support level.
For Short Trades: Look for selling opportunities when the price approaches resistance, confirming the reversal with bearish patterns, and placing a stop-loss slightly above the resistance level.
4. Using Breakouts
If the price breaks through a significant support or resistance level, it often leads to continued movement in that direction. Traders might enter trades in the breakout direction after confirming the break with increased volume.
5. Targeting and Exiting Trades
Set profit targets near the next identified S&R levels. For example, if you enter a long position at a support level, aim to take profits at the nearest resistance level.
6. Risk Management
Always use proper risk management techniques, such as limiting losses to a certain percentage of your trading capital per trade. A common practice is to risk no more than 1-2% of your account balance.
7. Adjusting Levels as the Market Evolves
Continuously monitor price action and adjust your S&R levels as needed. As new highs and lows are established, adjust your trading strategies accordingly.
Practical Considerations
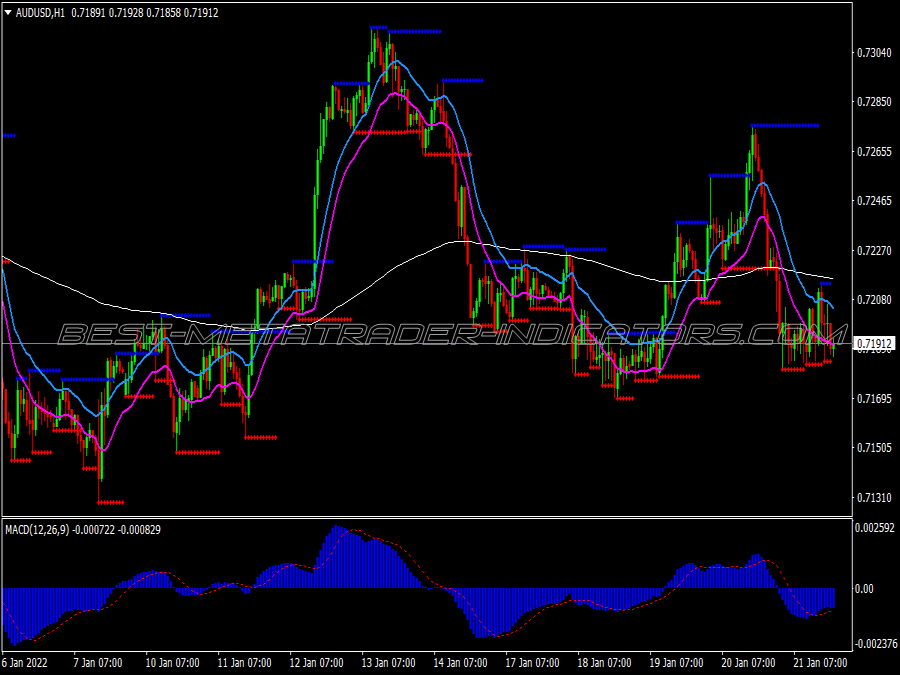
1. Combining Tools: While the S&R indicator is powerful, consider using it in conjunction with other technical tools like moving averages, RSI, or MACD for a comprehensive trading strategy.
2. Fundamental Events: Be aware of upcoming economic news or events that could influence price movements. S&R levels can be less reliable during high volatility periods associated with significant market news.
3. Journaling and Analysis: Keep a trading journal to analyze your trades based on S&R levels. Record what types of patterns were successful and refine your strategy over time.
4. Time Frames: Different time frames may yield varying S&R levels. Test your strategies across multiple time frames to identify the most reliable setups for your trading style.
5. Practice on a Demo Account: Before applying S&R trading strategies in a live account, practice on a demo account. This allows you to gain confidence and refine your approach without risking capital.
Conclusion
Utilizing the Support and Resistance indicator in MT4 provides traders with a structured approach to identifying potential trading opportunities. By following disciplined trading rules (identifying key levels, confirming with price action, employing effective risk management, and engaging in continuous learning and analysis) traders can leverage S&R for enhanced trading strategies. Remember, no approach is foolproof, but incorporating S&R levels into your trading plan can significantly improve your decision-making and outcomes in the markets.
