Submit your review | |
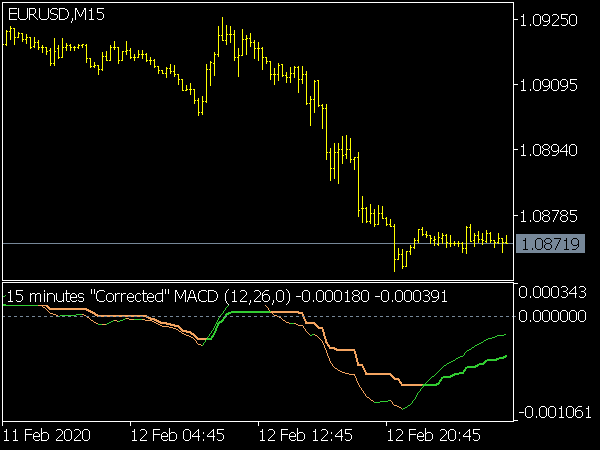
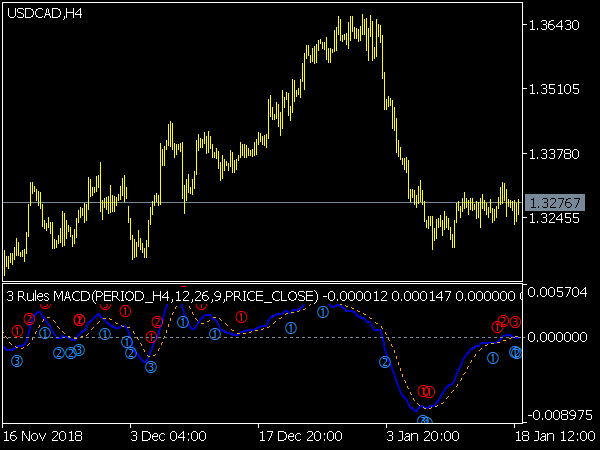
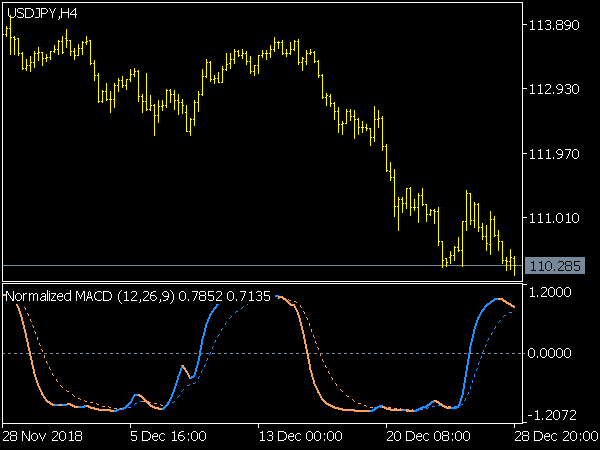
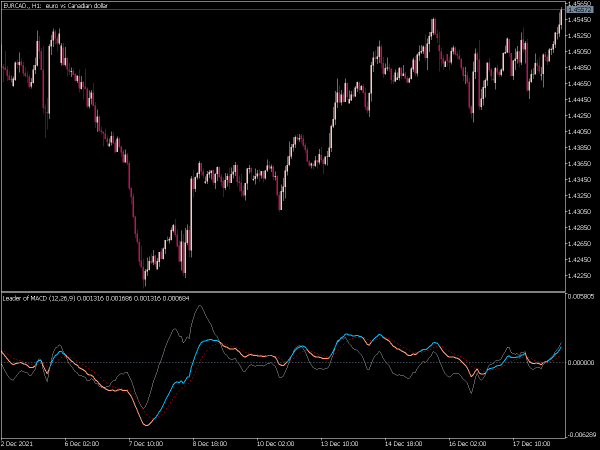
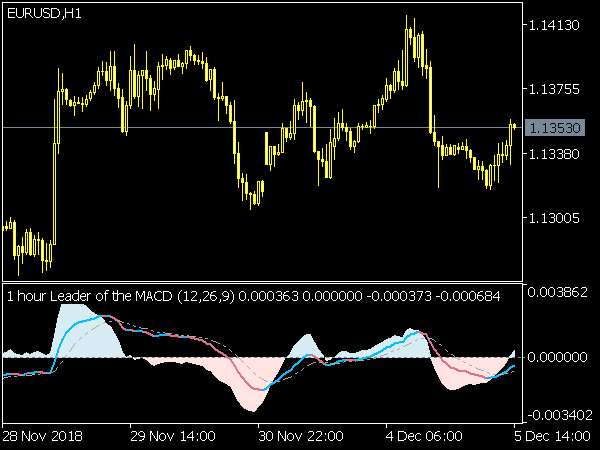
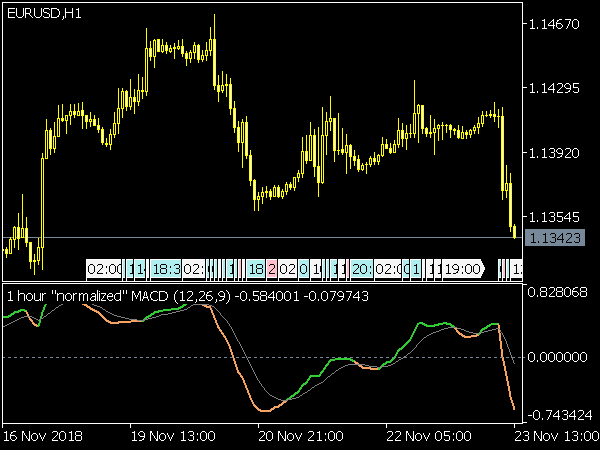
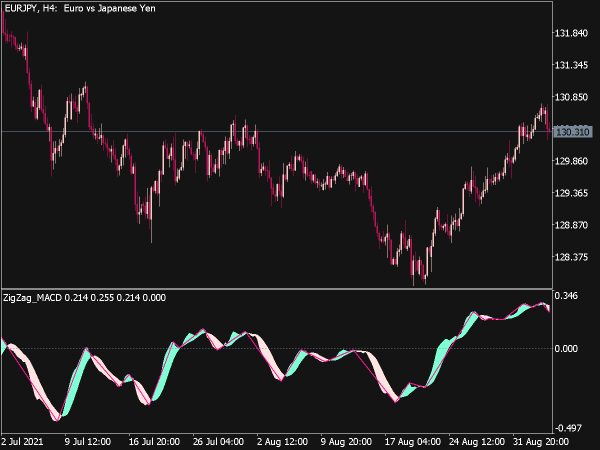
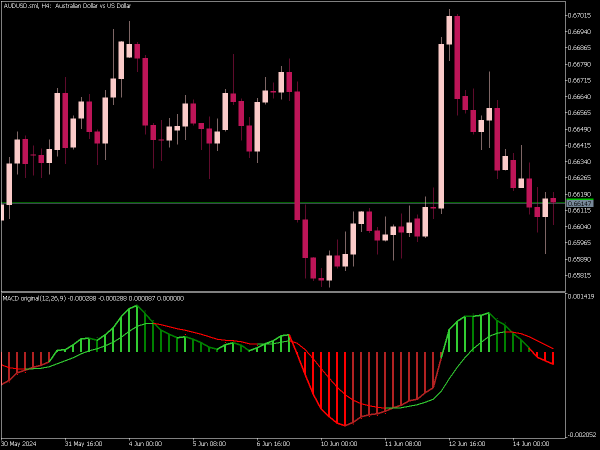
The MACD (Moving Average Convergence Divergence) indicator consists of two main lines: the MACD line and the signal line. The MACD line is calculated by subtracting the 26-period exponential moving average (EMA) from the 12-period EMA, while the signal line is typically a 9-period EMA of the MACD line itself.
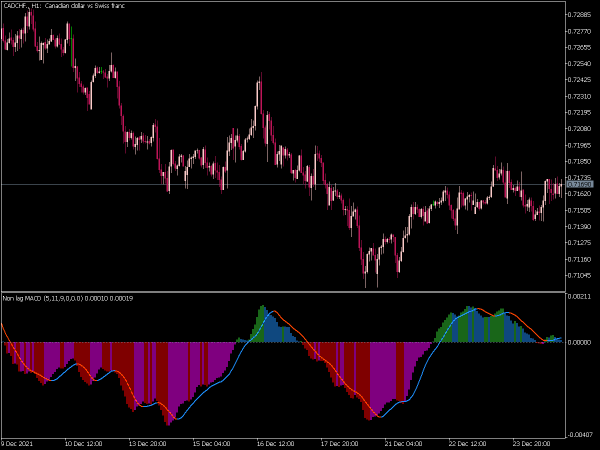
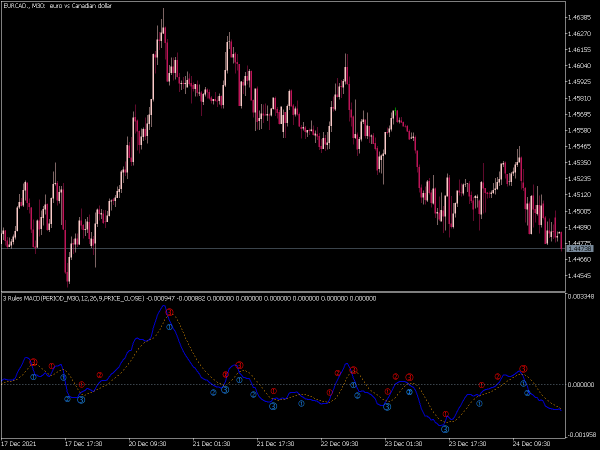
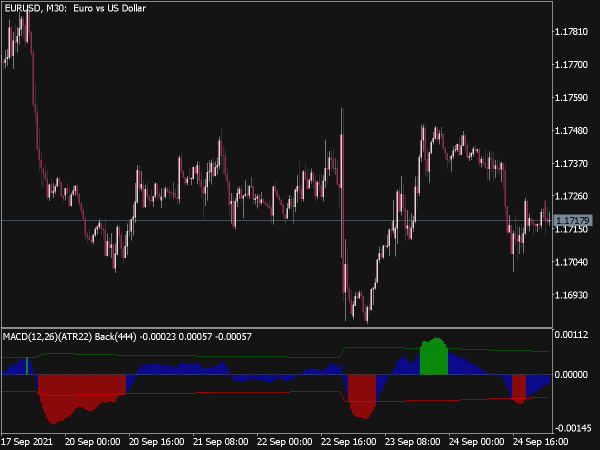
Traders use the intersection of these two lines to identify potential buy or sell signals: a bullish signal occurs when the MACD line crosses above the signal line, while a bearish signal happens when the MACD line crosses below the signal line. Additionally, the histogram, representing the difference between the MACD and signal lines, provides further insights into momentum and potential trend reversals.
Here’s a list of some effective MACD trading strategies:
1. MACD Crossover: This fundamental strategy involves tracking the two MACD lines (the MACD line and the signal line). A buy signal is generated when the MACD line crosses above the signal line, while a sell signal occurs when it crosses below.
2. Divergence Trading: This technique identifies discrepancies between price action and the MACD. Bullish divergence occurs when prices make lower lows while the MACD forms higher lows, indicating potential upward reversals. Conversely, bearish divergence suggests downward moves.
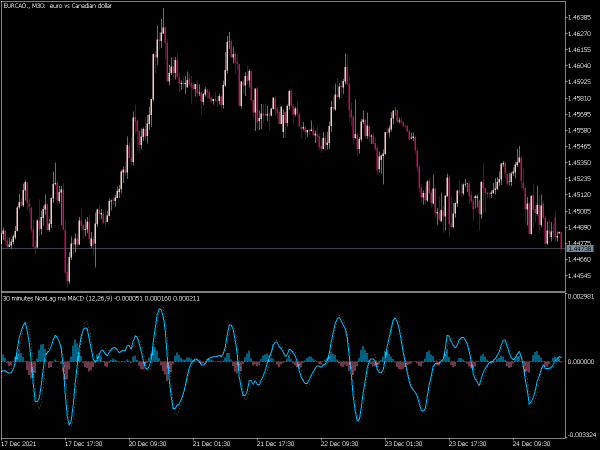
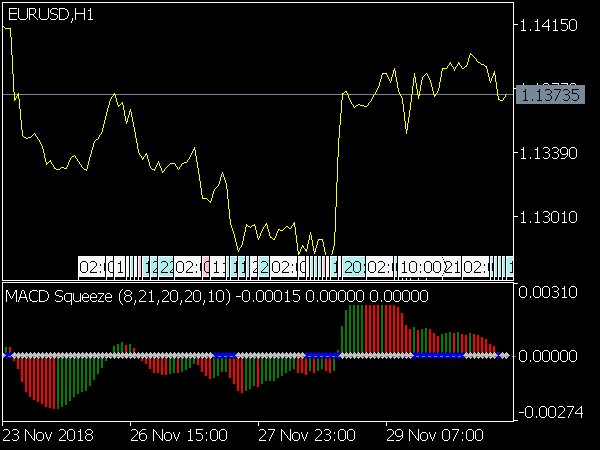
3. MACD Histogram: Analyzing the histogram can indicate momentum. A rising histogram suggests strengthening momentum, while a falling histogram signals weakening momentum. Traders look for histogram reversals as entry or exit points.
4. MACD and Price Action: Combining MACD signals with candlestick patterns or support/resistance levels enhances accuracy. For example, a crossover at a significant support level may indicate a stronger buy signal.
5. Timeframe Alignment: Using MACD across multiple timeframes can improve the reliability of signals. A MACD crossover on a daily chart, confirmed by a similar signal on a 4-hour chart, can provide stronger entry points.
6. MACD in Trending Markets: In strong trends, traders can look for pullbacks for MACD crossovers to enter trades in the direction of the trend. This strategy is particularly effective in trending markets.
7. Signal Line as Support/Resistance: The signal line can act as a dynamic support or resistance level. Watching for price bounces off the signal line can offer trade opportunities.
8. MACD with Other Indicators: Pairing MACD with other indicators, like RSI or Bollinger Bands, can filter signals and improve trade decisions. For instance, an overbought RSI signal combined with a bearish MACD crossover suggests a strong sell signal.
9. Trend Confirmation: Before relying solely on the MACD, assess the overall trend of the market. Only enter trades when the MACD confirms prevailing trends to reduce false signals.
10. Exit Strategies: A strong MACD cross can indicate entry, but scaling out of trades or setting profit targets based on MACD momentum changes can maximize profits while reducing risk exposure.
Incorporating these strategies within a well-structured trading plan can significantly enhance the effectiveness of the MACD indicator. Remember, it's crucial to backtest and validate any strategy in a demo environment before live trading.
The indicator is good 👍
Excellent Indicator
Can you share MACD settings similar or exactly as the one in 'pfe2-indicator.ex' ?
