Submit your review | |
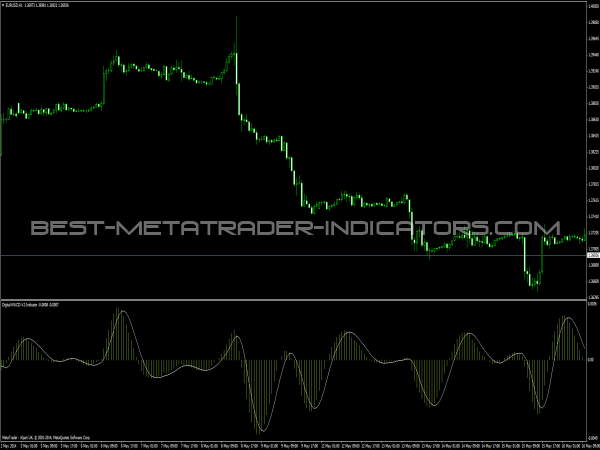
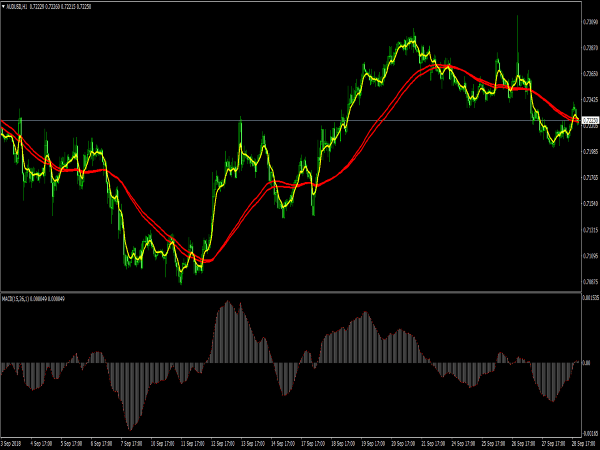
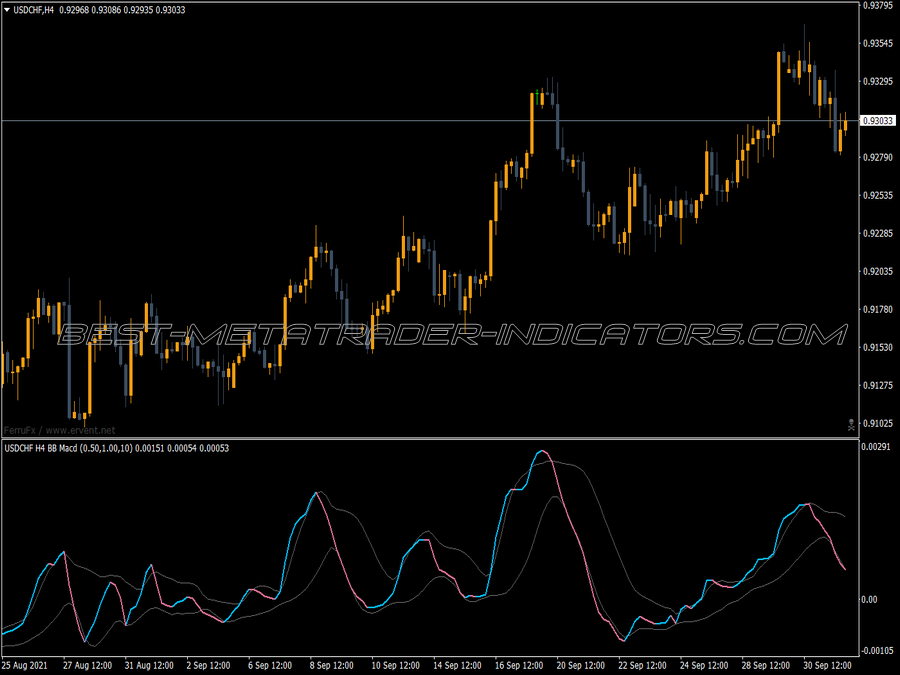
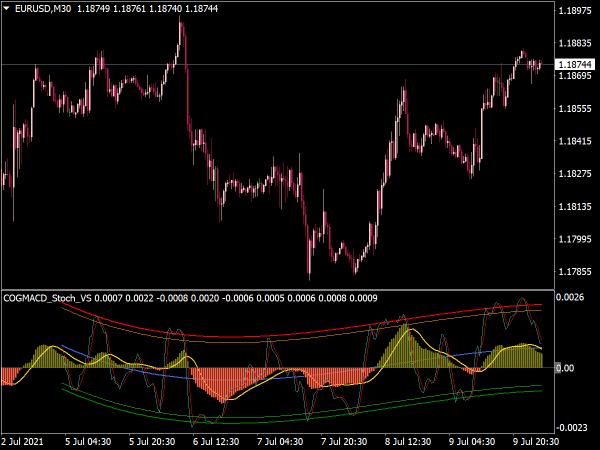
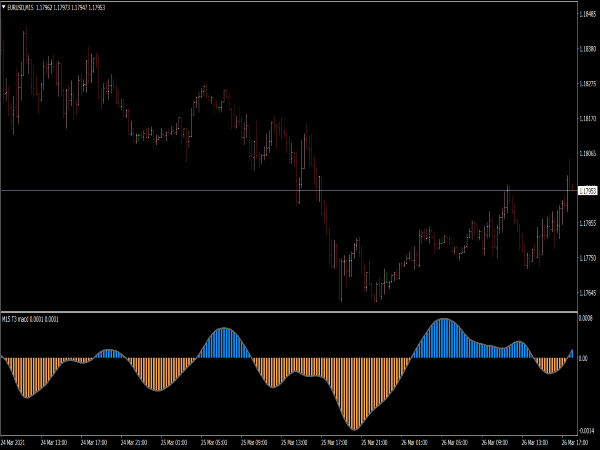
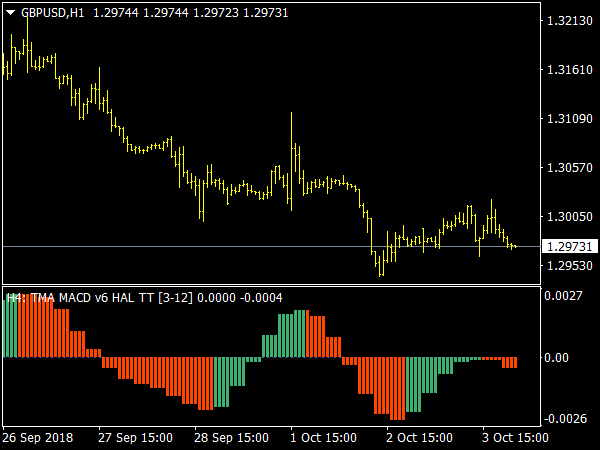
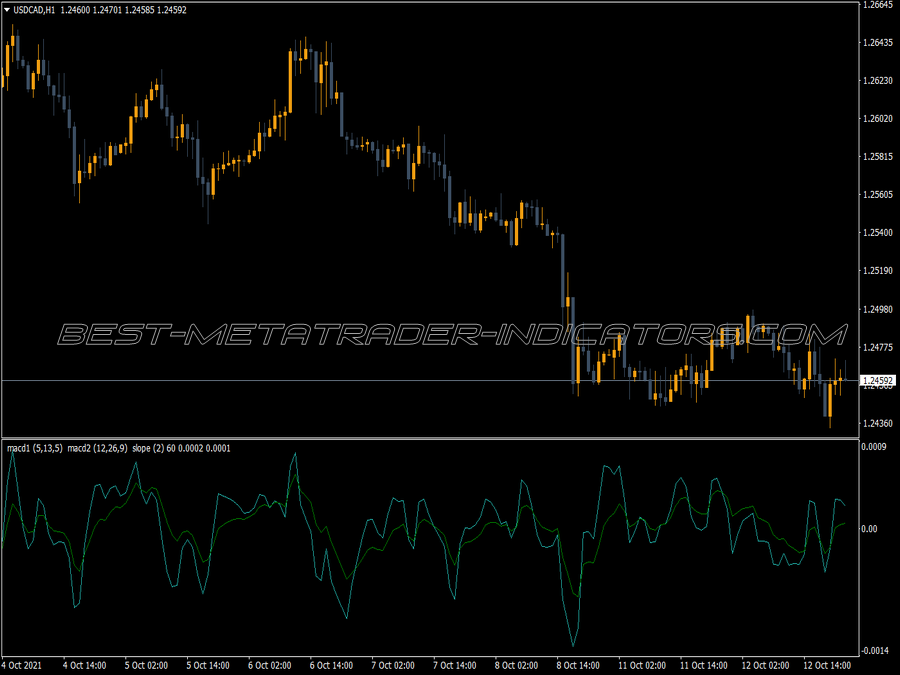
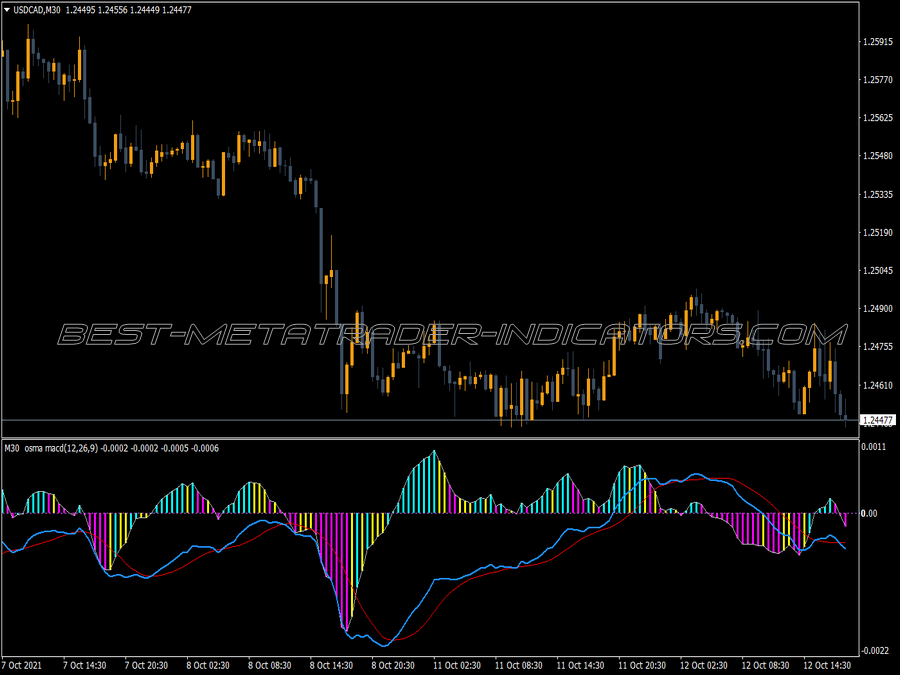
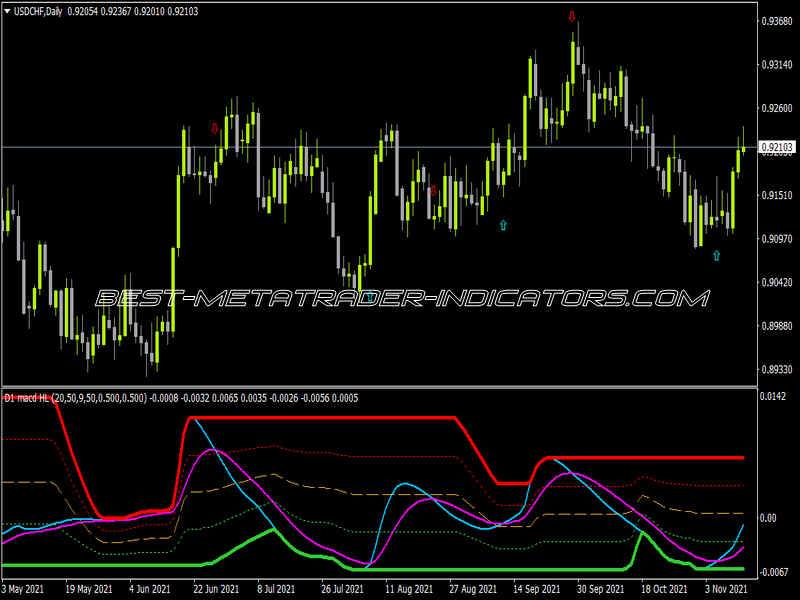
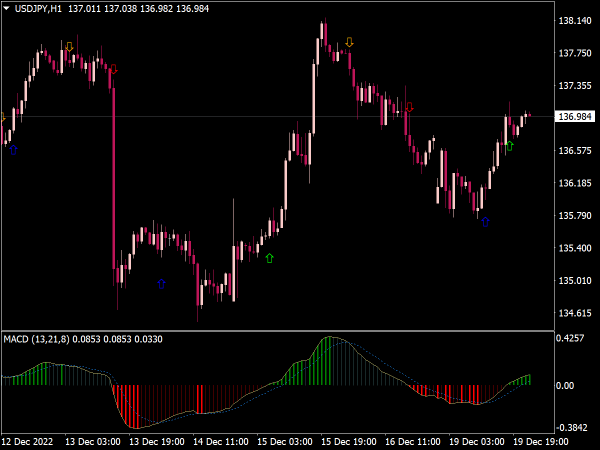
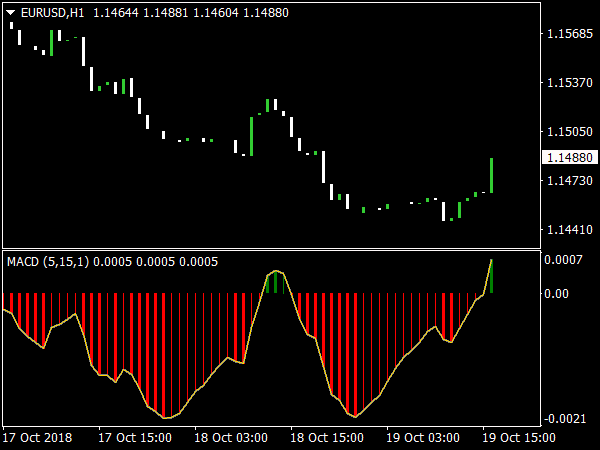
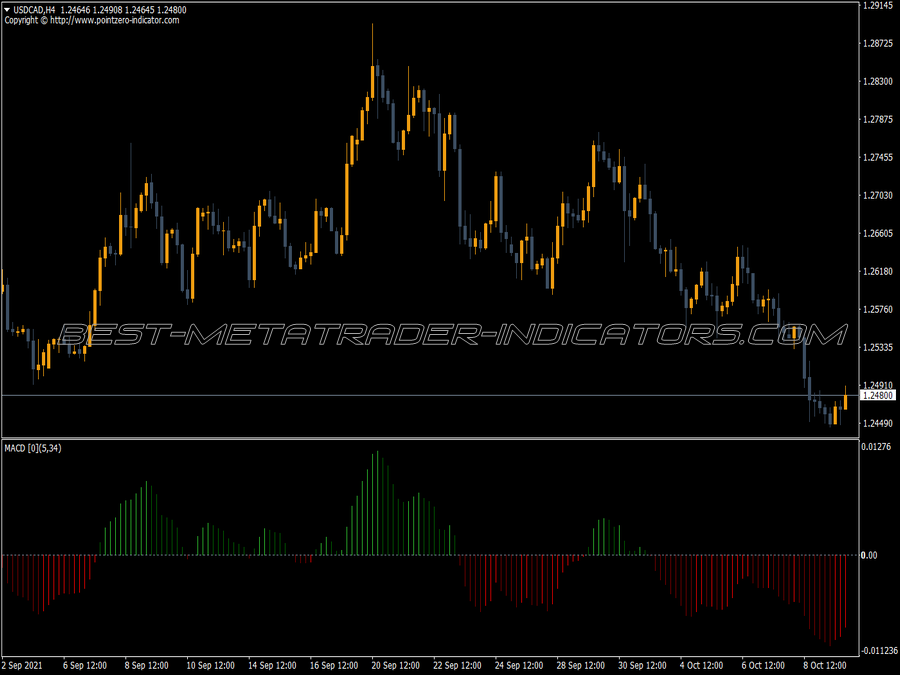
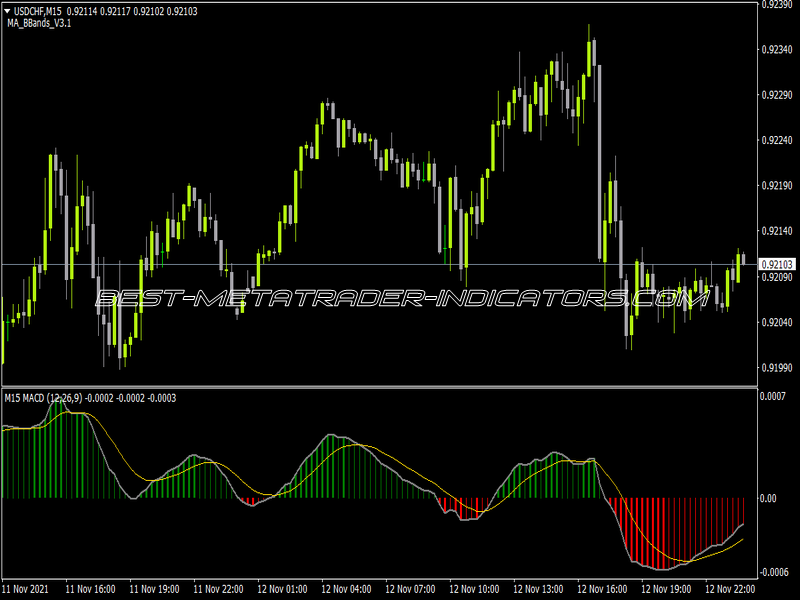
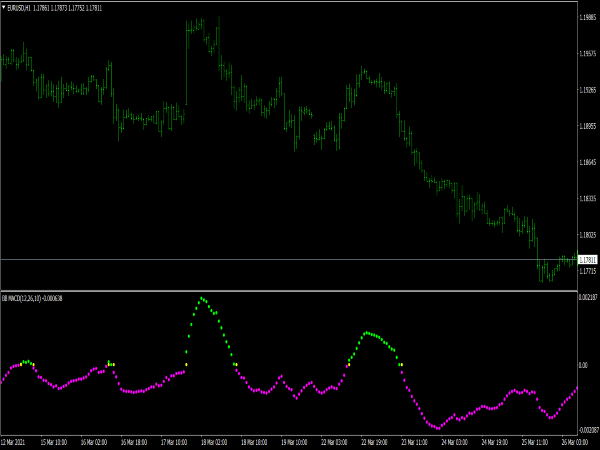
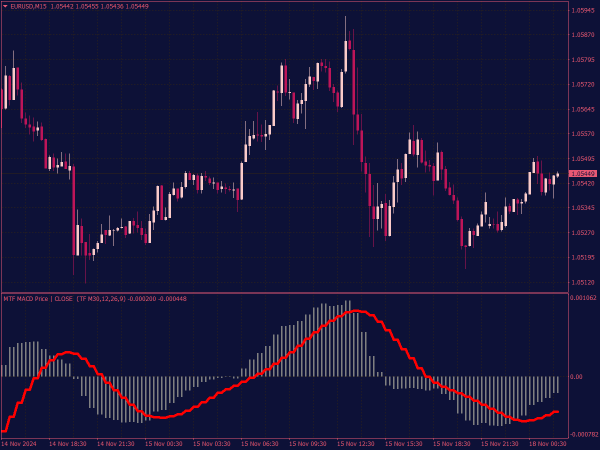
The MTF MACD indicator is a technical analysis tool used in trading that displays the MACD values from multiple time frames on a single chart. This allows traders to compare momentum across different periods, enhancing their trading decisions. Generally, it consists of two lines: the MACD line and the signal line, along with histogram bars that represent the difference between the two. By analyzing the MTF MACD, traders can identify potential buy or sell signals based on divergences and crossovers across time frames.
Here are several popular MACD strategies used in trading:
1. MACD Crossover Strategy: Enter a buy position when the MACD line (the difference between the 12-day and 26-day EMAs) crosses above the signal line (the 9-day EMA of the MACD), indicating upward momentum. Conversely, enter a sell position when the MACD line crosses below the signal line.
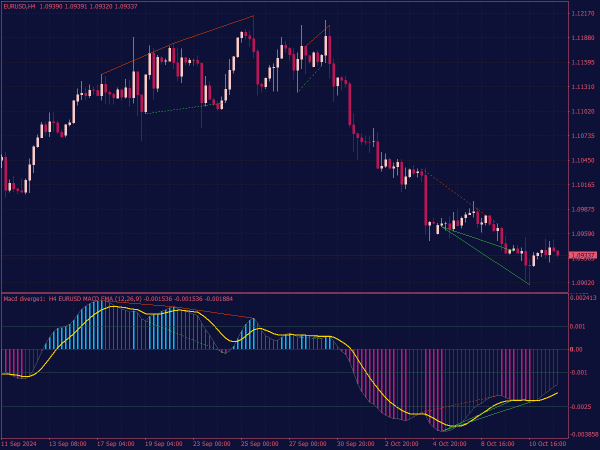
2. MACD Divergence: Look for divergence between the MACD and the price. If the price is making new highs while the MACD is making lower highs, it signals a potential reversal, suggesting a sell signal. A bullish divergence occurs when the price makes new lows while the MACD makes higher lows, suggesting a buy signal.
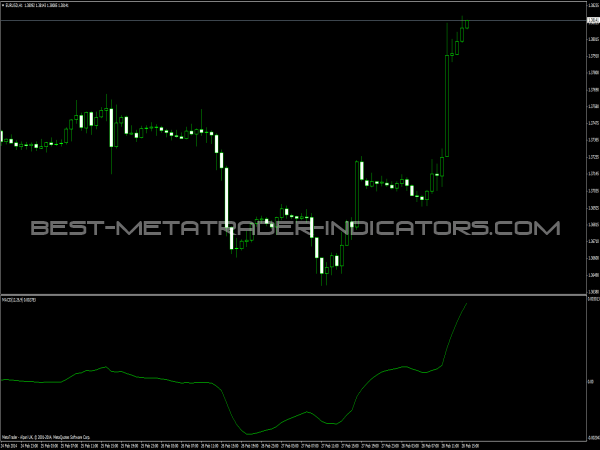
3. Zero Line Crossover: This strategy focuses on the MACD line crossing its zero line. A cross above zero indicates bullish momentum, suggesting a buy entry, while a cross below zero indicates bearish momentum, suggesting a sell entry.
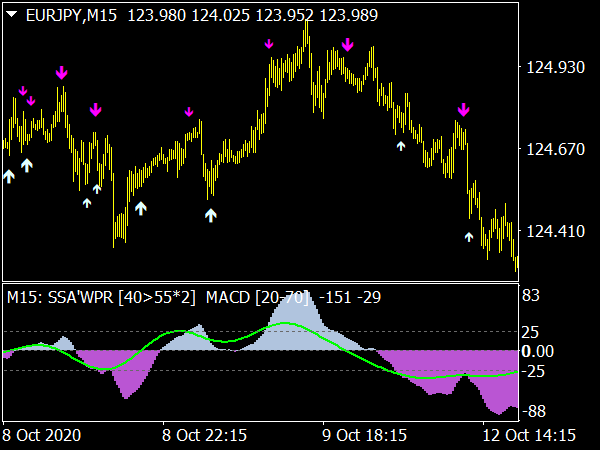
4. Histogram Reversal: Look for the MACD histogram to move from red to green (positive value) for potential buy entries and from green to red (negative value) for potential sell entries. This signifies a change in momentum.
5. Trend Continuation Strategy: Use the MACD in trending markets to identify entry points. In an uptrend, buy when the MACD is above the zero line and bounces off the signal line. In a downtrend, sell when the MACD is below the zero line and bounces off the signal line.
6. MACD and RSI Combo: Use the MACD alongside the RSI (Relative Strength Index). Enter a buy position when the MACD shows a bullish crossover while the RSI is above 30 (oversold area). Enter a sell when the MACD shows a bearish crossover and RSI is below 70 (overbought area).
7. Timeframe Confluence: Use multiple timeframes to enhance entry points. For instance, if the hourly MACD indicates a bullish crossover, look for confirmation in the daily chart. Trade only in the direction that is confirmed by the longer timeframe.
8. MACD Slowdown: Monitor the speed at which the MACD is moving. A slowdown in the MACD’s movement, specifically a flattening of the MACD line after a strong move, can signal a potential reversal or a good entry point for a reversal trade.
9. Multi-Indicator Confirmation: Confirm MACD signals with other technical indicators such as Bollinger Bands or moving averages. For example, if the MACD signals a buy and the price touches the lower Bollinger Band, it can reinforce the buy signal.
10. MACD Trend Strength: Use the distance between the MACD line and the signal line to gauge trend strength. A greater distance implies stronger momentum, leading to buy entries in uptrends and sell entries in downtrends when the momentum starts weakening.
11. Breakout Trading: Look for significant price levels (support and resistance) where the MACD aligns with breakout direction. Buy as the price breaks above resistance with MACD confirming momentum, or sell if the price breaks below support with corresponding MACD momentum.
12. 24-hour trading strategy: In a day trading context, utilize the MACD to enter trades based on 15-minute and 1-hour charts. Enter based on MACD crossovers during high-volume trading times, which often lead to clearer trends.
Implementing these strategies requires an understanding of market context, risk management, and if possible backtesting the strategies to refine entry criteria. Adjust settings of the MACD based on asset volatility and personal trading style for optimal results.
