Submit your review | |
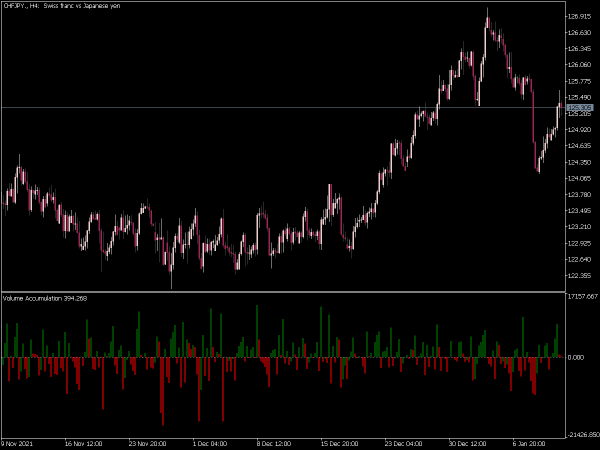
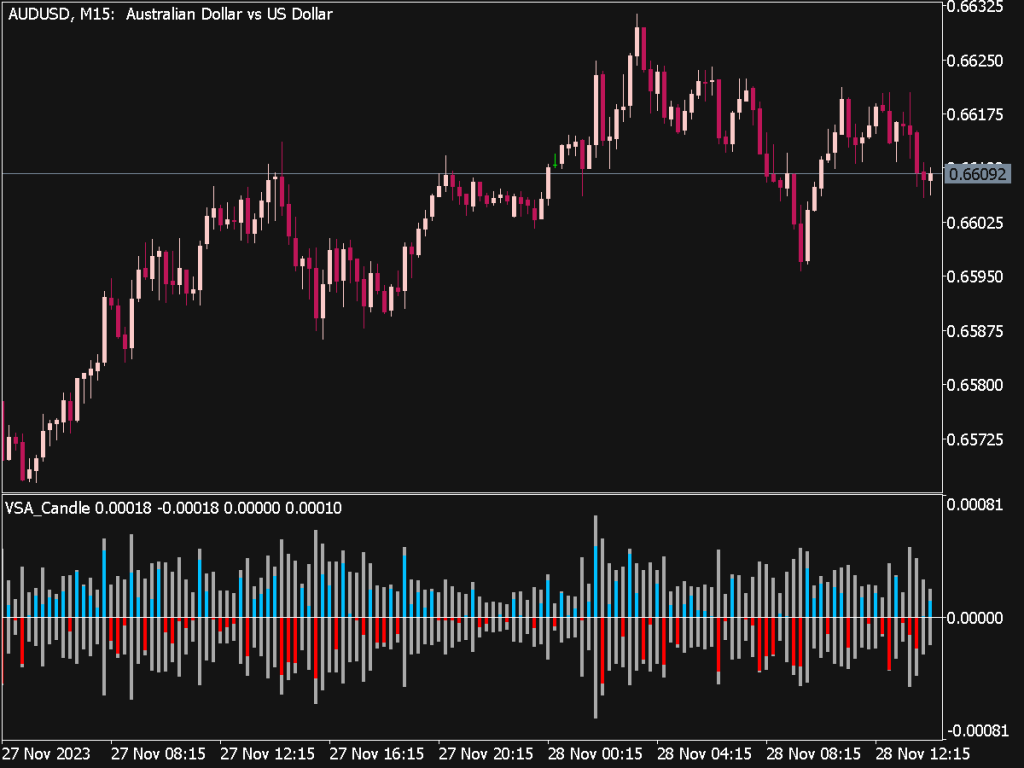
Volume Spread Analysis (VSA) is a trading methodology that examines the relationship between price and volume to detect potential market movements and trends. Here’s a concise overview of trading rules rooted in VSA principles:
1. Understanding the Basics: VSA focuses on analyzing the volume (the number of shares or contracts traded) alongside the spread (the difference between the high and low prices of a trading session) to interpret market sentiment.
2. Key Principles of VSA:
• Supply and Demand: Price movements result from changes in supply and demand. A wide spread with high volume may indicate strong buying or selling, while a narrow spread suggests indecision.
• Significant Changes: Look for significant changes in both volume and price. An increase in volume alongside a down candle may suggest weakness in the market; conversely, high volume accompanying an up price movement may indicate strong buying interest.
3. Identifying Market Structure: VSA emphasizes understanding market context, including support and resistance levels, trends, and chart patterns. The analysis might involve distinguishing between bullish and bearish conditions: for example, a breakout above resistance with high volume typically signals a strong bullish move.
4. Trading Rules:
• Rule 1: Confirm Breakouts: Ensure that breakouts through support or resistance levels are accompanied by increased volume to confirm the strength of the move.
• Rule 2: Beware of False Signals: If prices rise or fall dramatically with low volume, it suggests a lack of consensus among traders, leading to potential false breakouts.
• Rule 3: Look for Divergence: Watch for divergences between price and volume. For instance, if price increases but volume decreases, this may indicate weakening momentum, prompting caution in continuation trades.
• Rule 4: Reactions to News: Pay attention to how volume responds around major news events. High volume can signal that institutional traders are acting on news, providing context for potential price movements.
5. Entry and Exit Strategies:
• Entry Signals: Consider entering a trade when the price breaks above a significant level with strong volume supporting the movement.
• Exit Signals: When price approaches historical resistance levels with increasing volume, consider taking profits. Conversely, if price moves against your position with increasing volume, reevaluate for potential exit.
6. Risk Management: VSA trading involves considerable risk management. Always set stop losses based on volatility and recent price action. For example, if a stock breaks resistance but shows signs of reversal, a stop loss just below the breakout point can protect against adverse moves.
7. Combining with Other Indicators: Many traders successfully integrate VSA with other tools and indicators (like RSI, MACD, or moving averages) to confirm signals and enhance decision-making processes.
8. Continuous Learning and Adaptation: Markets evolve, so staying informed about market conditions and continuously refining your trading approach is crucial for long-term success with VSA.
In summary, Volume Spread Analysis offers a sophisticated lens through which traders can interpret market movements. By effectively utilizing trading rules that focus on the interplay between price and volume, traders can better navigate the complexities of the market and increase their potential for profitable trades.
