Submit your review | |
It is very important for stochastics to be applied in different time frames, if possible in three. It is more suitable for time frame analysis than most other oscillators. However, it should be noted that it only shows its strengths in the short to medium range, i.e. up to about 16 bars. If you go much further, it is only a trend indicator. The following remarks relate mainly to the Slow Stochastic. The Fast Stochastic essentially corresponds to the indicator that has become known as Williams %R and will be discussed below.
Extreme zones
Reaching and leaving the extreme zones hardly provides good signals in stochastics. Only, as with all oscillators, they are usable in sideways movements. Even much stronger than the other oscillators, stochastics tend to be in the extreme range for a very long time when there is a strong trend. You can try to take advantage of this with Stochastic Pop. An indication that the trend will continue is the absence of hinge and warning.
As a rule, the price will then only make a consolidation or a short correction and the stochastics will only make a dent, sometimes leaving the extreme range for a very short time, but then going back in very quickly. In principle, one should consider all indicators, not only according to the extreme zones, but carry out a concrete zone analysis. This is particularly important here in stochastics, as the levels fluctuate very strongly from market to market. There are a number of markets where the neutral range covers only 20 ranging from 40 to 60 as an example.
Divergence
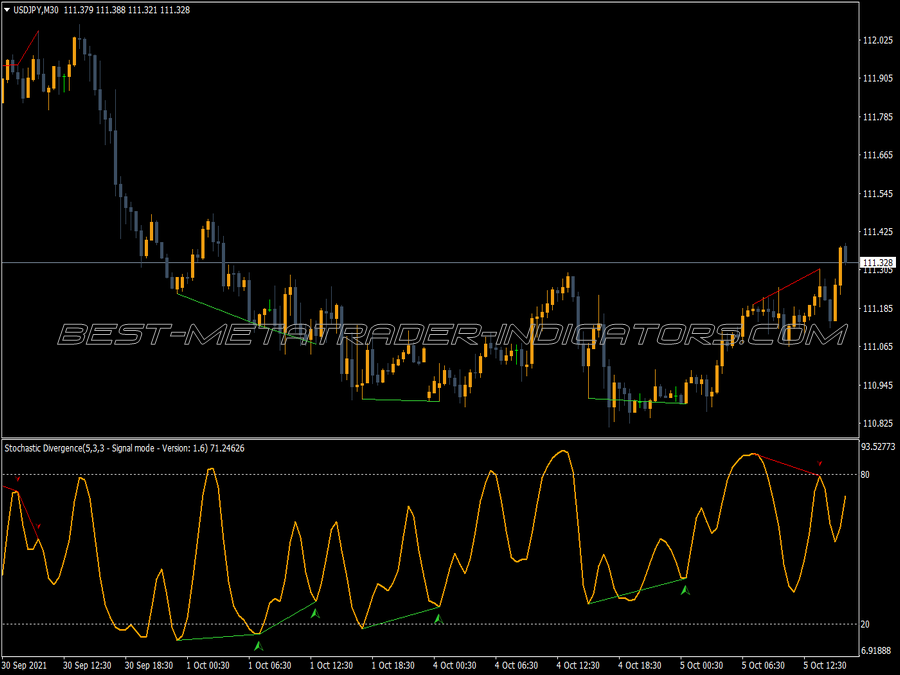
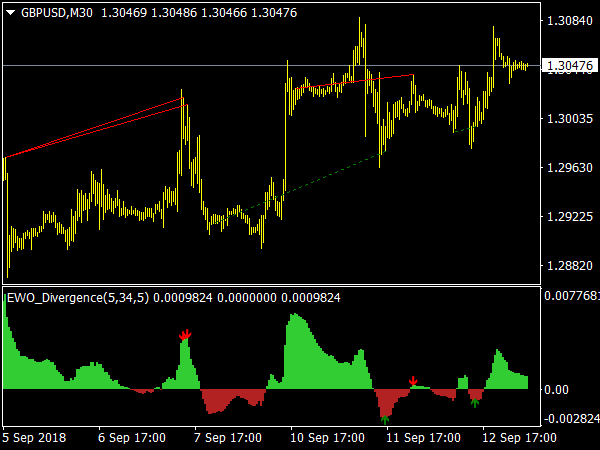
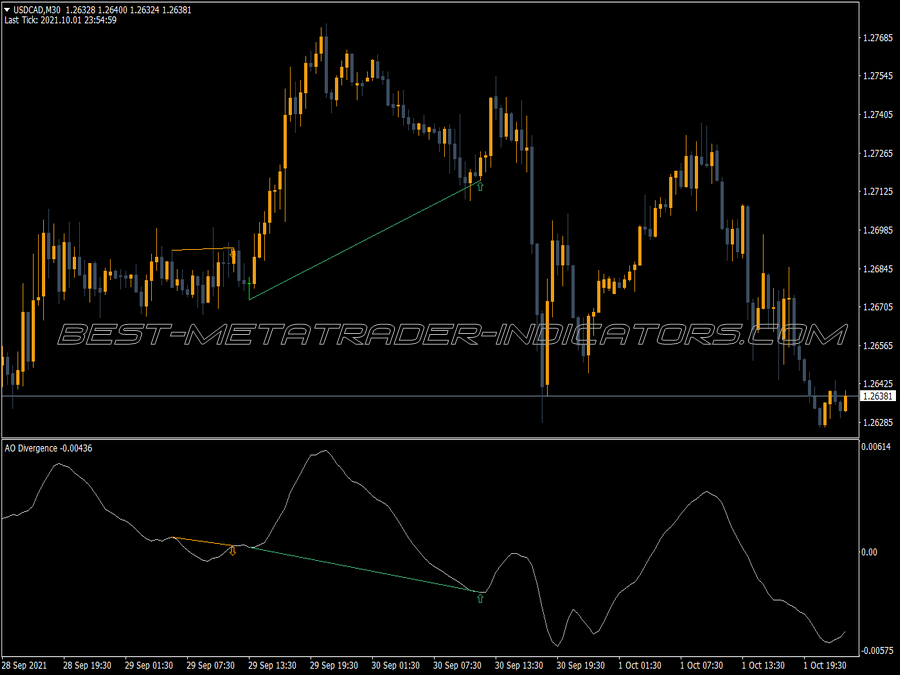
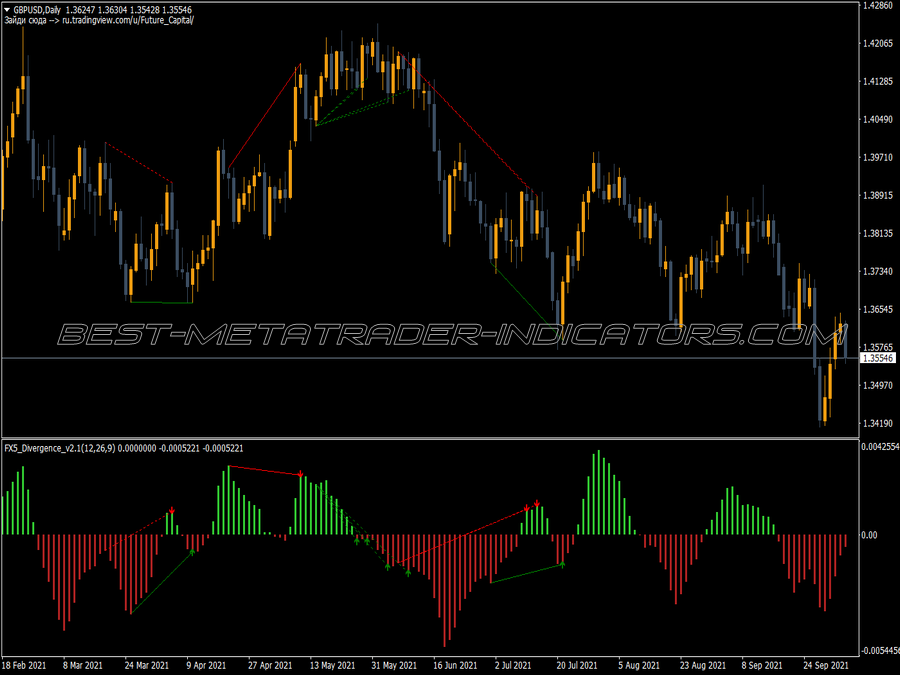
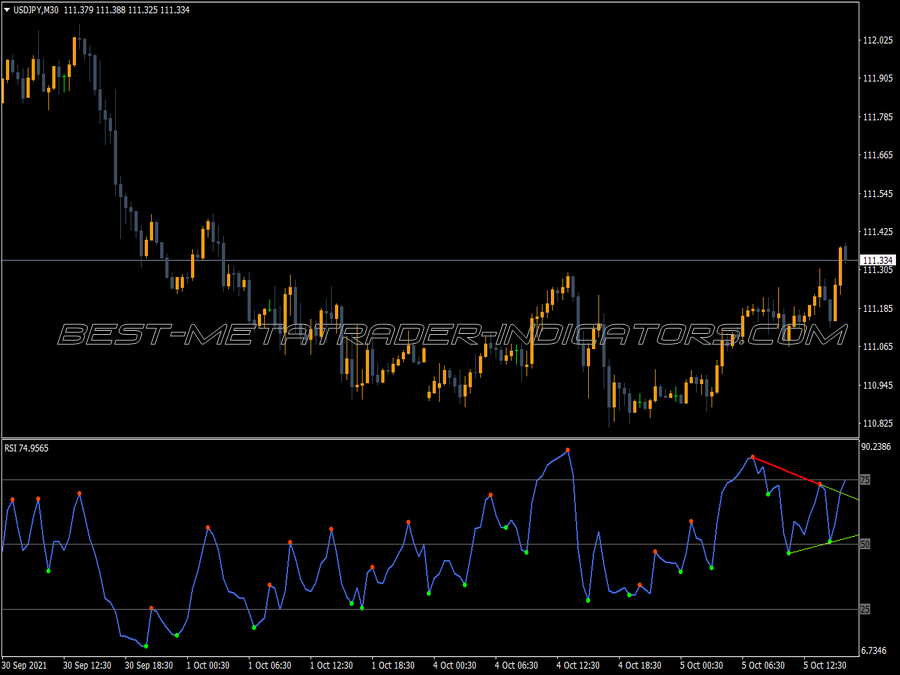
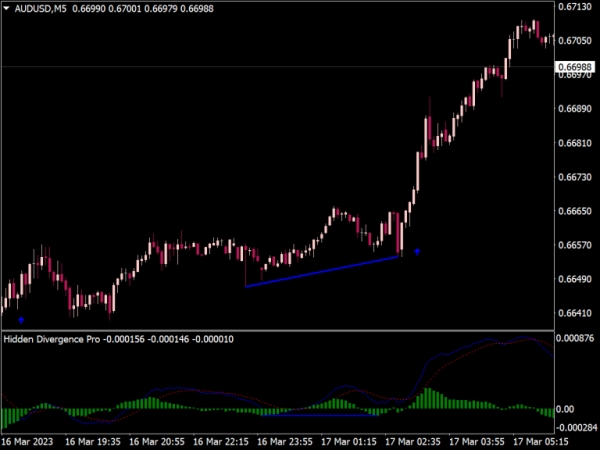
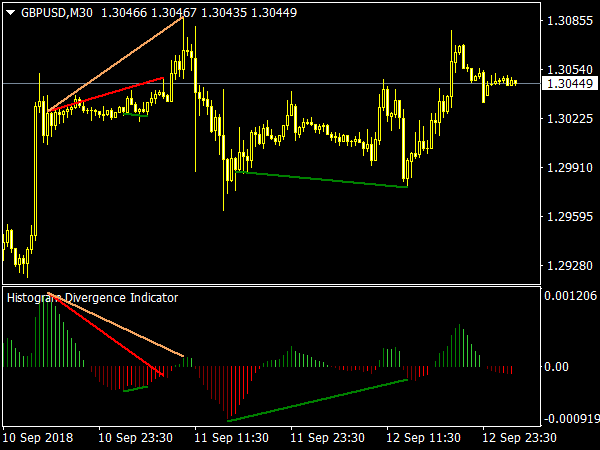
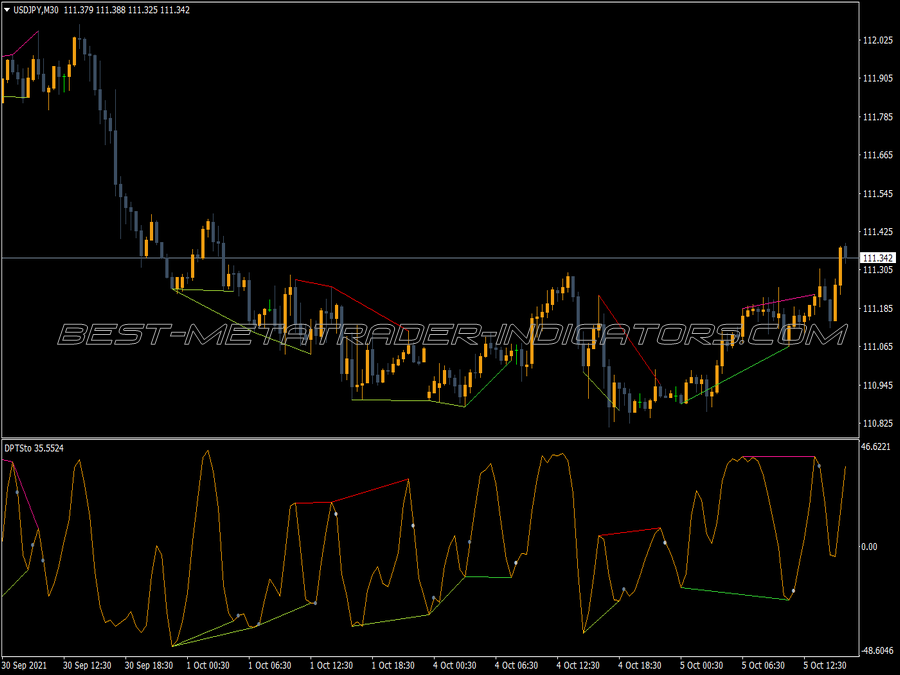
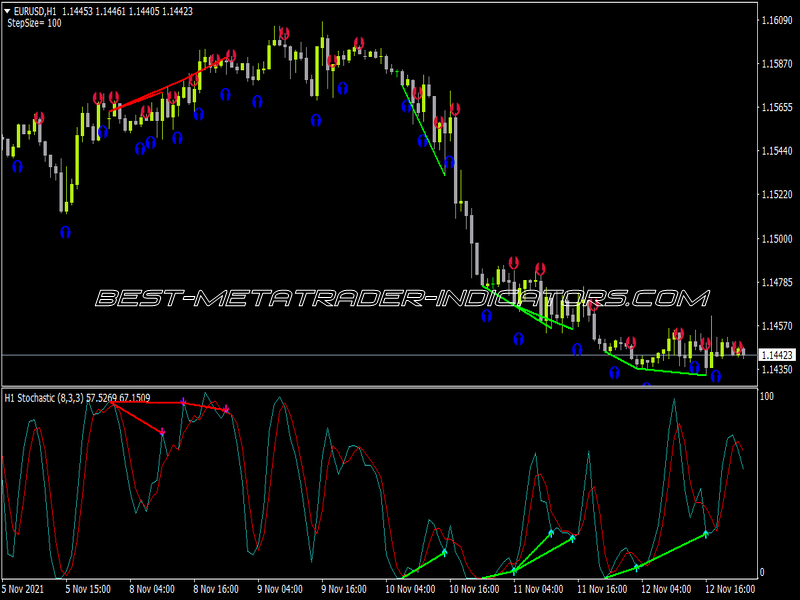
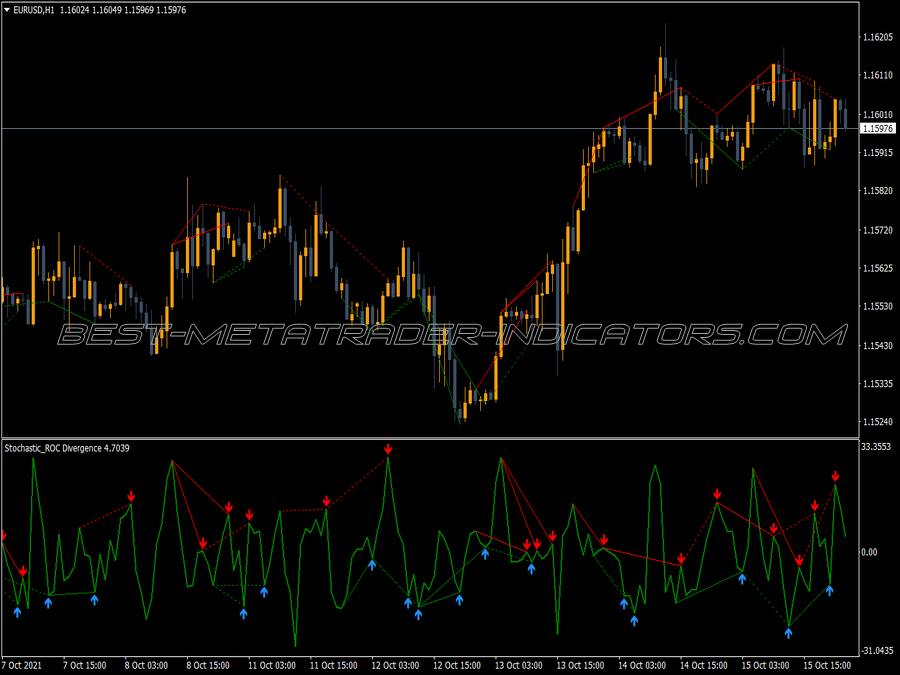
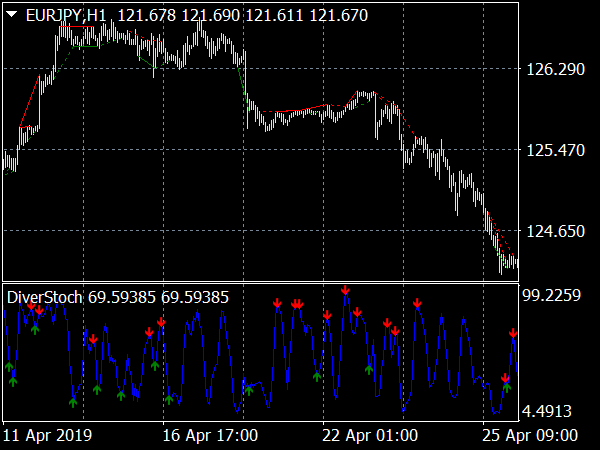
The stochastic offers good divergence signals, especially because multiple divergences rarely occur. The signals are very safe if the first part of the divergence has taken place in the extreme range, while the second part no longer reaches it, i.e. is a failure swing. The reverse divergences are also very important. They usually give good signals in stochastics, but often only the following trend movement brings the final turn.
Crossover
The inventor of stochastics, George Lane, assumed that the right-sided crossovers of the two lines are safer than cutting on the left side. However, this rule usually does not apply to today's markets. But it doesn't hurt if you think about it in addition. However, in general, the crossover signals are not good enough to use them meaningfully for trading. On the other hand, a convergence gives a useful signal, it shows that prices will continue in the direction of the trend for some time to come. Convergence refers to the state when both stochastic lines, i.e. %K and %D, go in the same direction.
Trend lines and formations
A special feature of stochastics is that certain statements can be derived from its form.
Warning
A warning is a sudden sharp drop or rise against the trend in stochastics by at least 6%, if possible in an extreme range. Even if prices go back in trend direction after that, a turnaround is likely soon. The buckling happens quite suddenly, so it is a sharp V-turn in the indicator, usually no more than 12%. The warning has a relatively large lead time, usually two periods.
Hinge
The stochastic line flattens out after a very steep movement, but still goes in the direction of the trend. Sometimes the flattening is such that the hinge, or also called hook, even goes sideways, that is, is horizontal. It is a fairly safe warning of the trend change that is likely to occur in the next period.
Knee and shoulder
These are very typical formations, the shoulder in the upper region, the knee on the floor. The stochastic line makes a kind of double top or double bottom, where the second low is higher than the first, and the second top is lower than the first. In both cases, you will come close to your trigger line without cutting it. It is a very typical reversing signal.
The two formations come from George Lane and are specifically intended by him for stochastics, they can be found in a similar form but also with other indicators. The knee is bullish, the shoulder bearish. On the other hand, the classic formations are rarely found in stochastics, and the trend lines are also not good. In general, short sharp turns in stochastics indicate that the trend is weakening. Large widths, on the other hand, indicate a continuing strength in the trend.
Failure Swing
These signals come relatively late in stochastics, it makes more sense to trade the divergence before that. The failure swings are very good if they are part of a divergence at the same time. These signals are very favorable if they are simultaneously part of a divergence. Especially if the first turn took place in the extreme range, while the second no longer reaches it.
Remarks
The stochastic is particularly well suited for time frame analysis, i.e. the comparison of several stochastics with different temporal lengths. One should then only trade the signals of the shorter-term when they go in the direction of the longer. In principle, of course, you can also do the analysis with all other indicators, but stochastics is particularly suitable for this.
Whenever cycles or wave-like structures dominate in the market, stochastics works very well, whereas in trend markets you can only trade in the respective trend direction. In general, the signals are better in the direction of the overarching trend, this, of course, applies to all oscillators, but stochastics have a certain relation to the trend, stronger than others.
A special feature of stochastics is that the shape and type of the turns also give a good signal. Large and broad reversals indicate that the trend is still quite strong, it will probably continue. Short and sharp turns, on the other hand, show that the trend is weakening. If the price has already moved strongly after a turn, without the stochastics leaving the extreme range, the turn will not last long, but the movement will continue.
