Submit your review | |
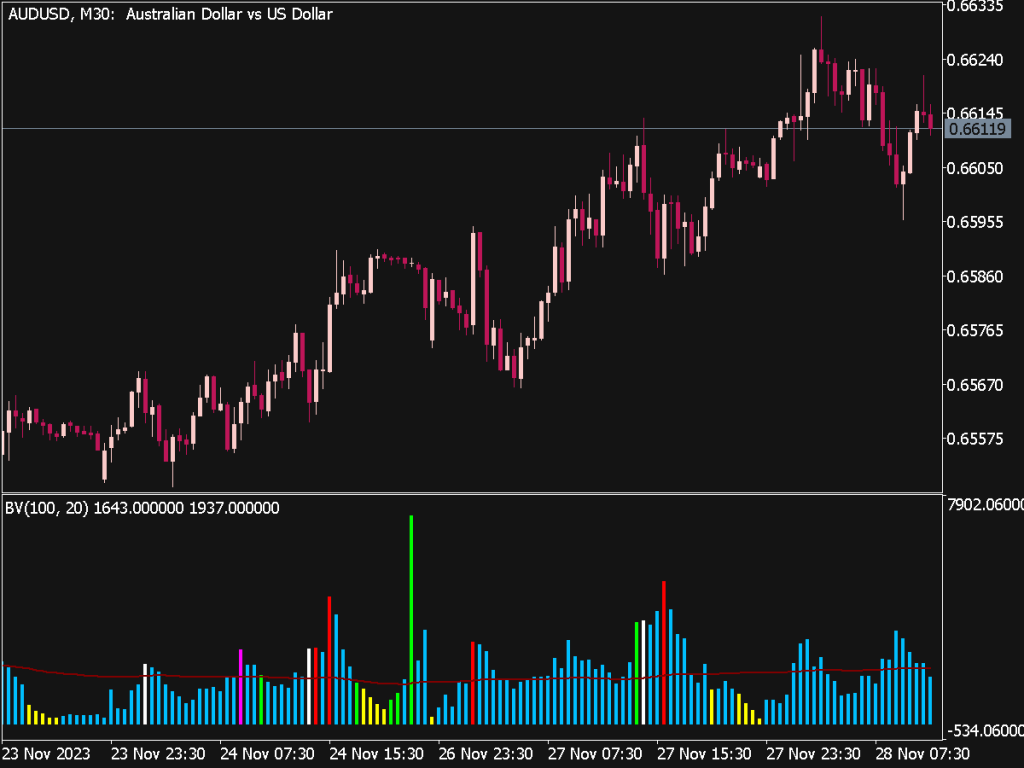
The Better Volume Indicator is a technical analysis tool that combines price action with volume data to identify potential market trends and reversals. By emphasizing the importance of volume alongside price movements, traders can gain insights into market sentiment and strength. To effectively utilize the Better Volume Indicator, here are several trading rules and strategies:
1. Understand the Indicator: The Better Volume Indicator distinguishes between different types of volume bars, such as high-volume up bars, low-volume down bars, and vice versa. Familiarize yourself with these signals, as they provide context for interpreting market behavior.
2. Look for Divergences: Identify divergences between price and volume. For example, if the price reaches a new high but the volume shows decreased buying pressure, this could indicate potential weakness and a reversal. Conversely, a price decrease accompanied by high volume may signal strong selling pressure.
3. Monitor Breakouts: When a stock breaks through a key resistance level or support zone, pay attention to the volume accompanying the breakout. A breakout supported by high volume is more likely to be genuine, while low volume could suggest a false breakout.
4. Volume Spikes: Watch for abrupt spikes in volume, as these can signify significant market events. Volume spikes often precede price reversals; a sudden increase during a downtrend may mark a potential bottom, while a spike during an uptrend may indicate a potential peak.
5. Combine with Other Indicators: Use the Better Volume Indicator in conjunction with other technical indicators like moving averages, RSI, or MACD for confirmation. For example, if the Better Volume Indicator suggests a bullish trend, confirm it with a bullish crossover on the MACD.
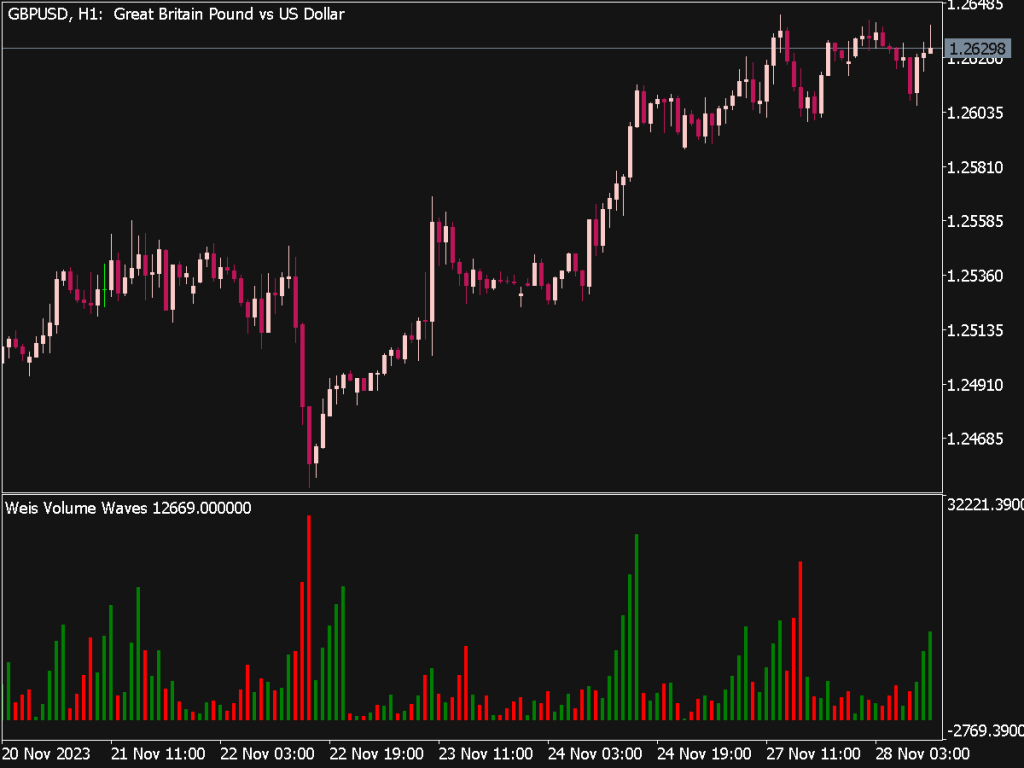
6. Trend Confirmation: Analyze overall market trends using the Better Volume Indicator. In a bullish trend, look for high volume on up days and lower volume on down days, which suggests that buyers are in control. In a bearish trend, you should see the opposite.
7. Use Time Frames: Test the Better Volume Indicator across multiple time frames. Short-term traders might benefit from intraday signals, while longer-term investors can use daily or weekly charts to spot larger trends.
8. Set Entry and Exit Points: Establish clear entry and exit strategies based on volume signals. For instance, enter a trade after a price confirmation with high volume and set a stop loss below a recent low or a previous support level.
9. Risk Management: Always apply sound risk management principles. Determine your risk-reward ratio before entering a trade and adjust your position size accordingly to protect your capital.
10. Backtesting and Practice: Before applying these strategies in a live trading environment, backtest your approach using historical data to evaluate effectiveness. Additionally, consider paper trading to refine your strategies without financial risk.
11. Market Context: Be mindful of the broader market context affecting the stock you're trading. News events, earnings reports, or economic data releases can have significant impacts on volume and price, making it essential to consider these factors in your analysis.
12. Mindset and Discipline: Maintain a disciplined mindset and emotional control when trading. The Better Volume Indicator is a tool, but successful trading also requires practicing patience and sticking to your analysis.
In summary, the Better Volume Indicator offers valuable insights into market dynamics by correlating price action with volume activity. By understanding its components, recognizing divergences, and applying complementary strategies, traders can improve their ability to make informed trading decisions. Always prioritize risk management, backtest strategies, and remain aware of market conditions to enhance the effectiveness of your trading approach.
