Submit your review | |
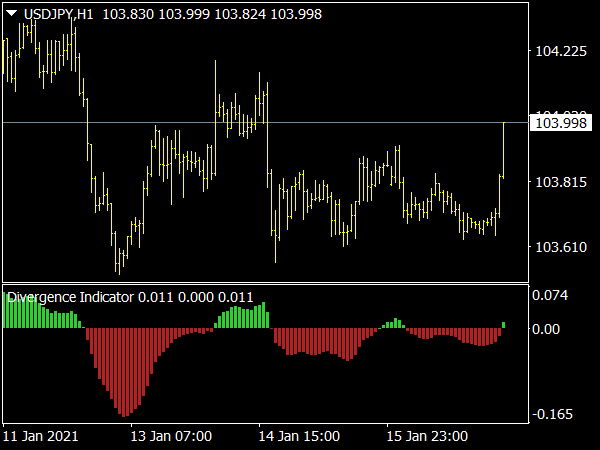
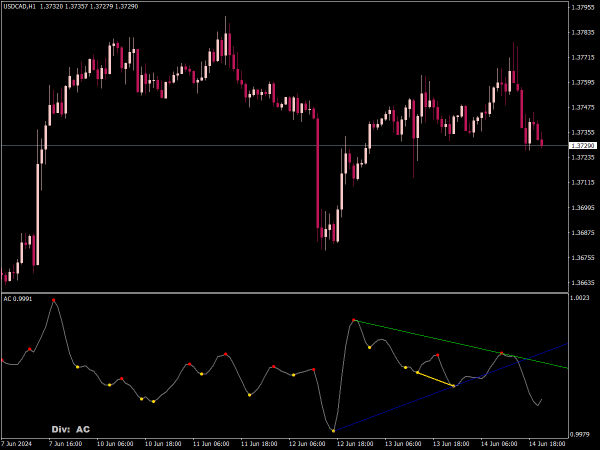
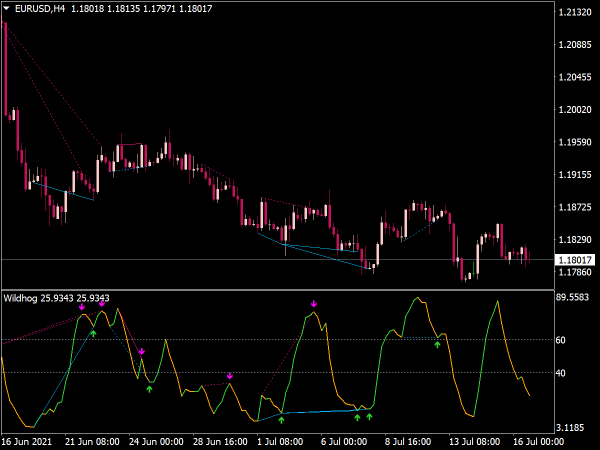
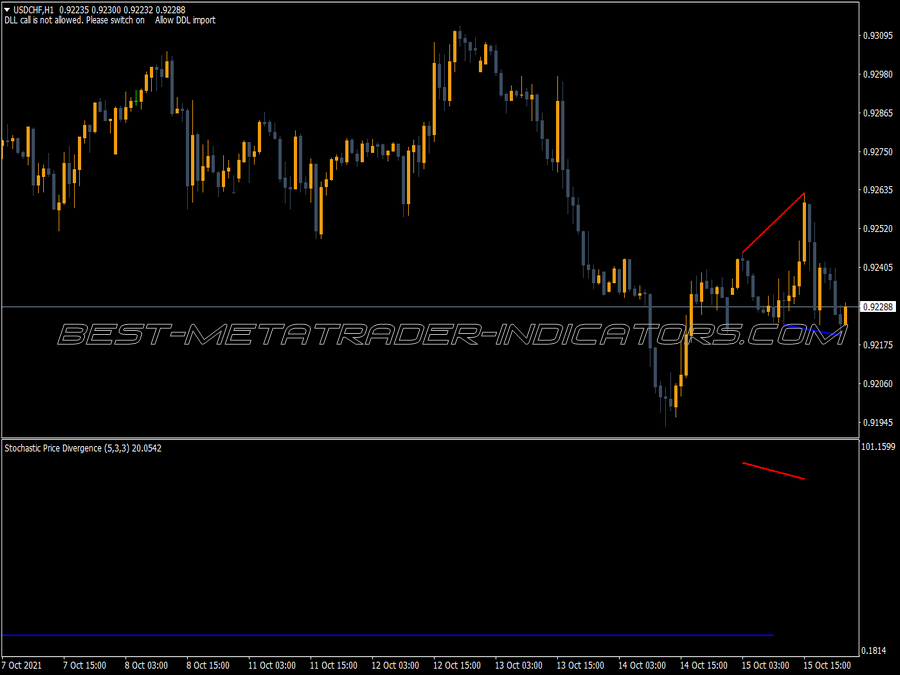
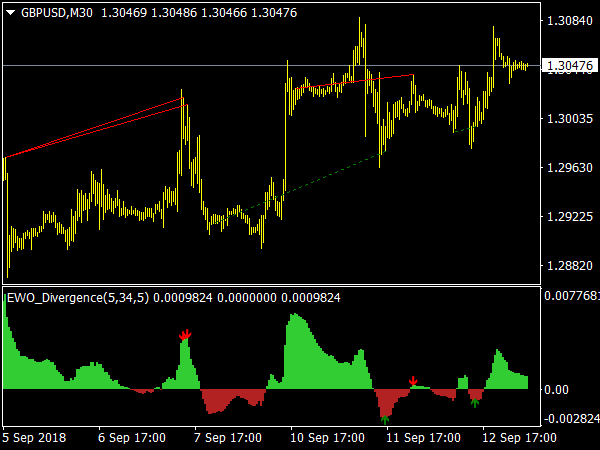
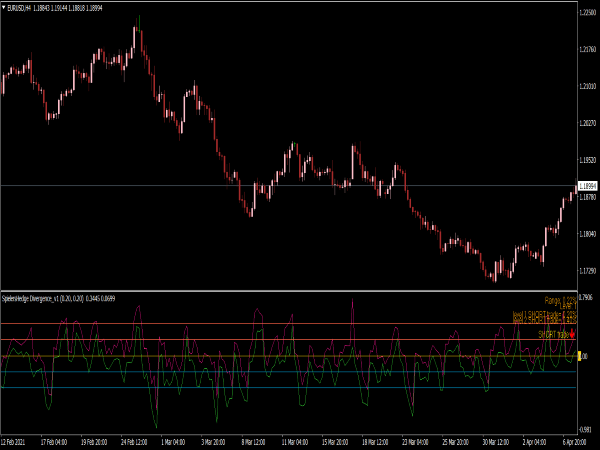
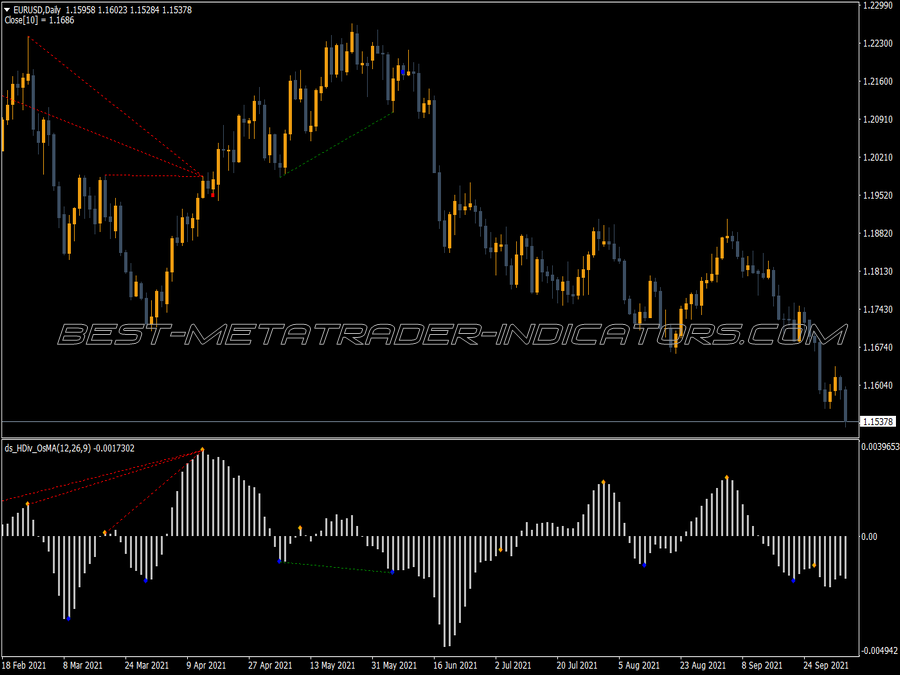
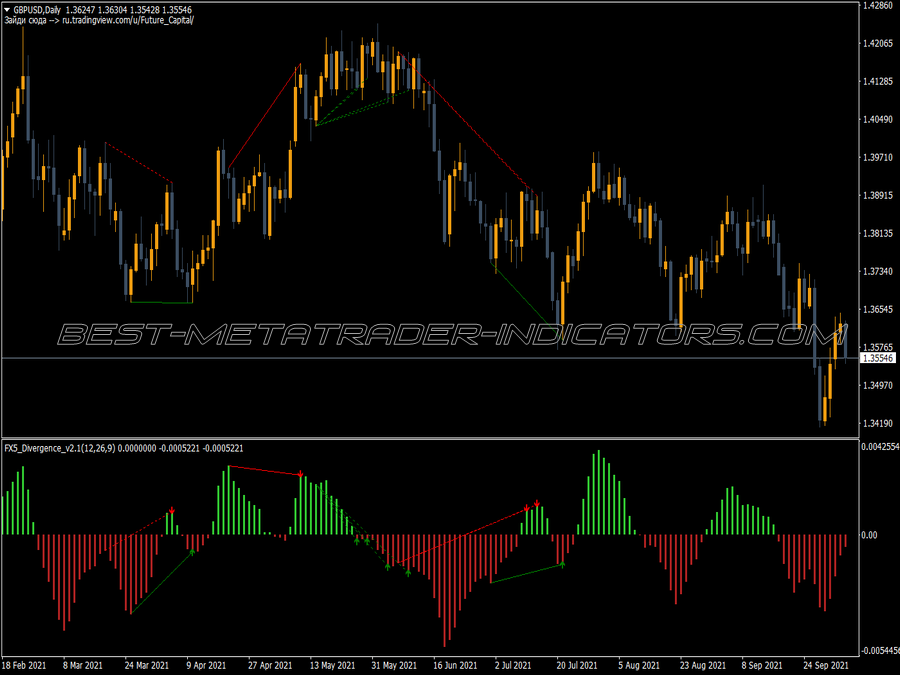
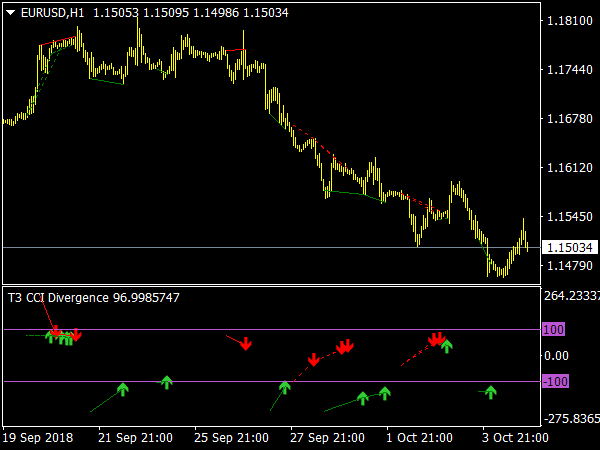
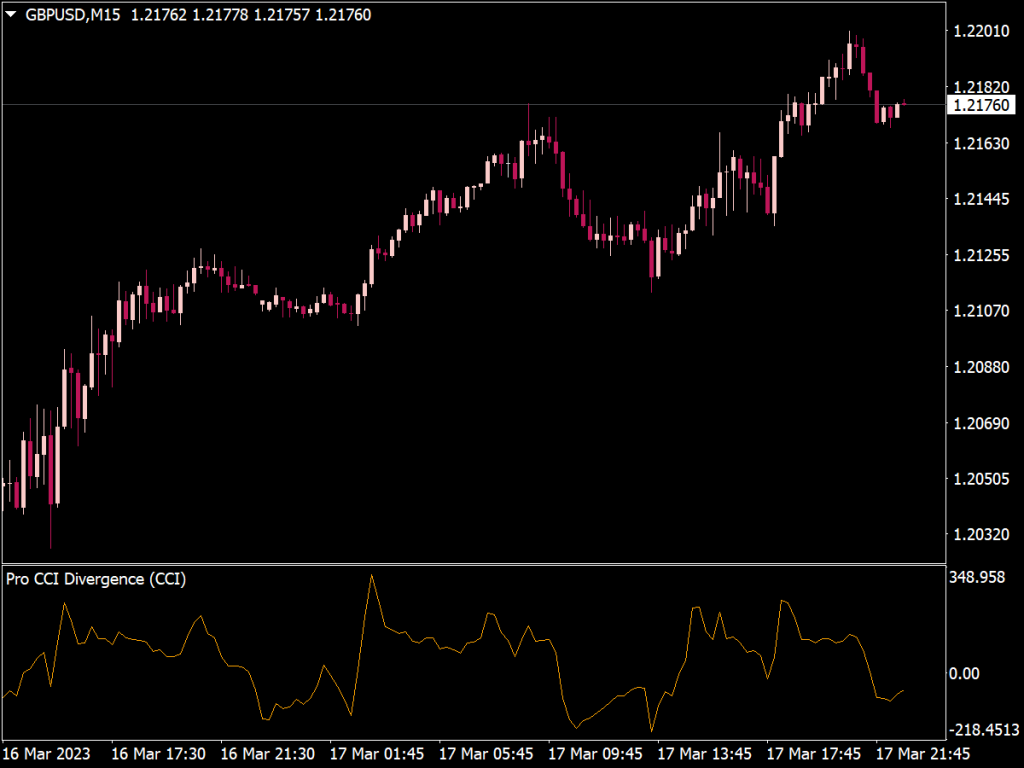
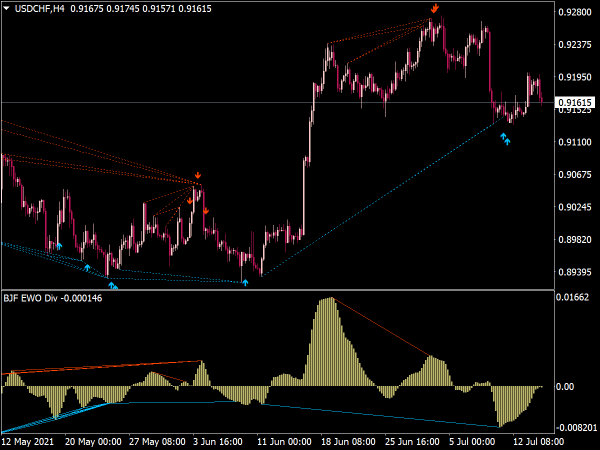
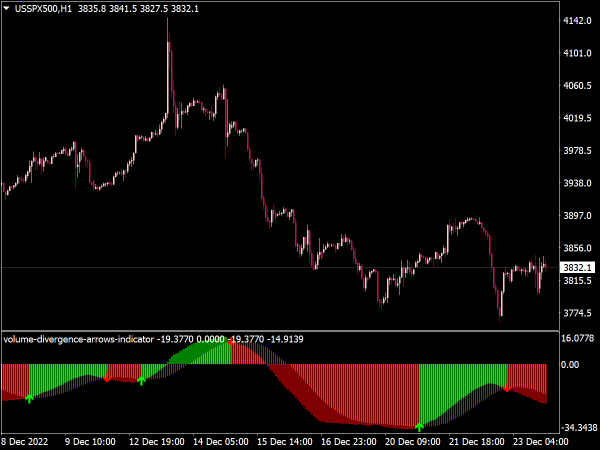
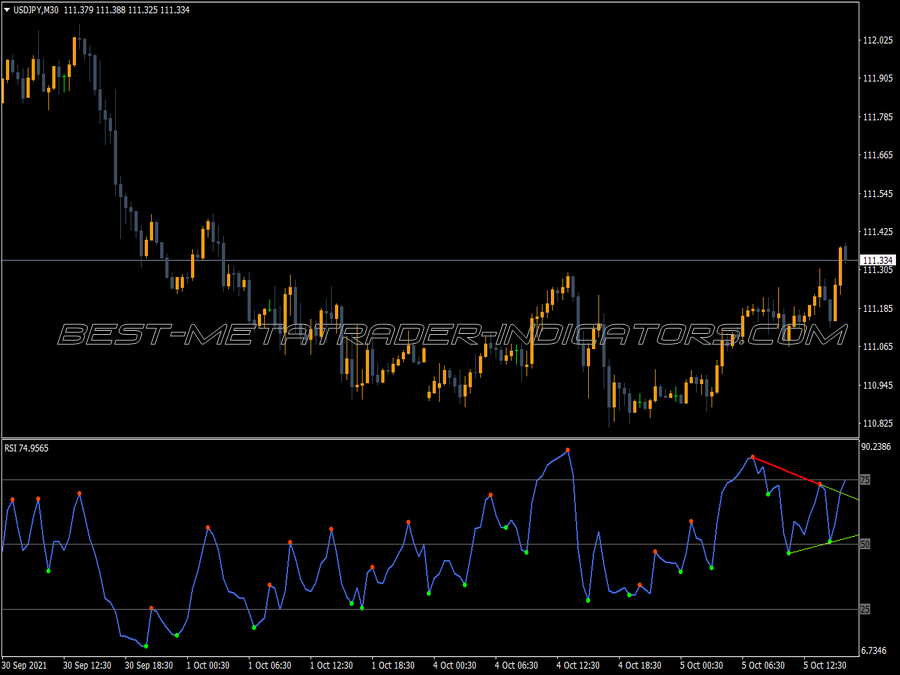
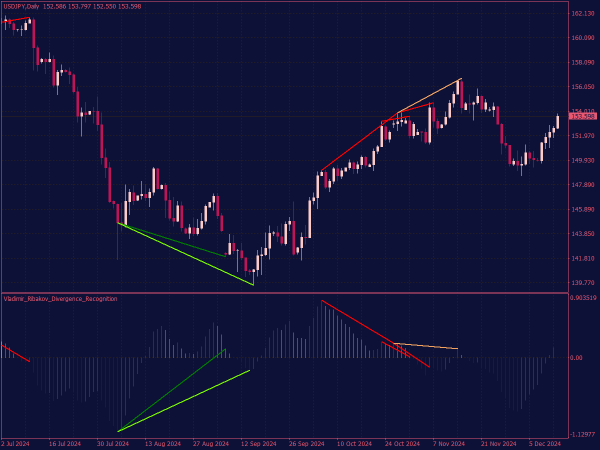
The Divergence Recognition Indicator (DRI) is a technical analysis tool used to identify potential reversals in financial markets by spotting divergences between price movement and an underlying indicator, such as an oscillator (e.g., RSI or MACD).
When the price makes new highs or lows but the indicator does not, it suggests a weakening trend and may indicate a potential change in direction. Traders use this information to make informed entry and exit decisions in their trading strategies, aiming to capitalize on the anticipated market shifts.
Types of Divergence
1. Regular Divergence:
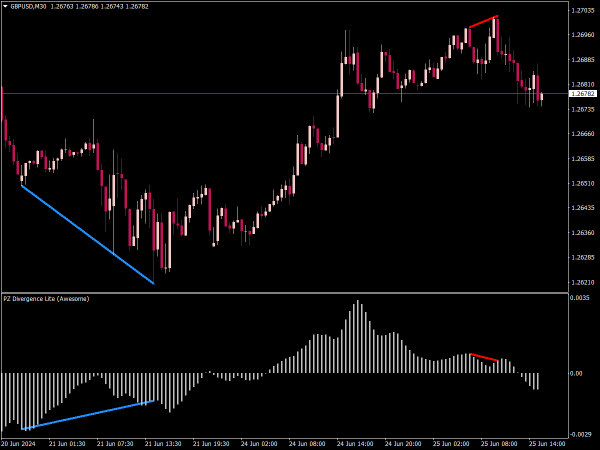
• Bullish Divergence: This occurs when the price makes a lower low while the indicator makes a higher low. This scenario suggests that the selling pressure is weakening, and a potential reversal to the upside could be imminent.
• Bearish Divergence: This happens when the price makes a higher high, but the indicator makes a lower high. This indicates that buying momentum is weakening, suggesting a potential reversal to the downside.
2. Hidden Divergence:
• Bullish Hidden Divergence: This occurs when the price makes a higher low while the indicator makes a lower low. This divergence suggests that the trend is likely to continue upwards, as the strength of the current upward movement remains intact.
• Bearish Hidden Divergence: This occurs when the price makes a lower high while the indicator makes a higher high. This indicates the continuation of a bearish trend, suggesting that the current price decline is likely to persist.
Several indicators can be used to identify divergences, including:
• Relative Strength Index (RSI): The RSI is a momentum oscillator that measures the speed and change of price movements. It ranges from 0 to 100, with values above 70 suggesting overbought conditions and below 30 indicating oversold conditions.
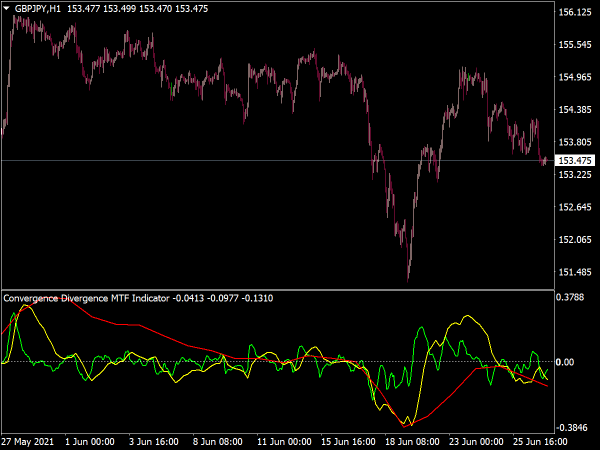
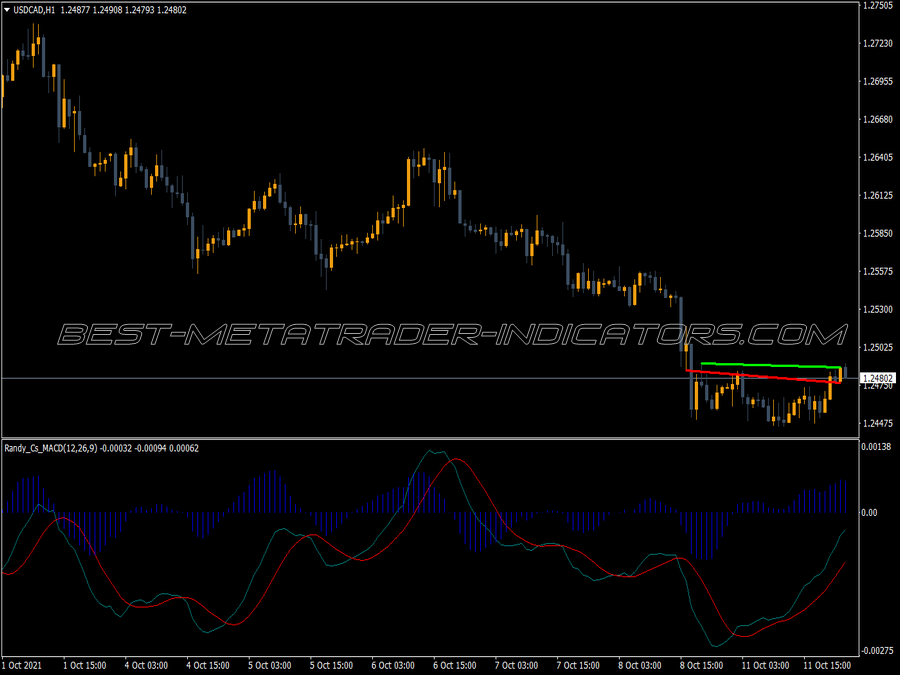
• Moving Average Convergence Divergence (MACD): The MACD consists of two moving averages (the 12-day EMA and the 26-day EMA) and a signal line (9-day EMA). Divergence in MACD can suggest potential reversals when the MACD line diverges from price trends.
• Stochastic Oscillator: This oscillator compares a particular closing price of an asset to a range of its prices over a certain period. It is also bounded between 0 and 100 and can highlight potential divergences.
• On-Balance Volume (OBV): OBV uses volume flow to predict changes in stock price based on the premise that volume precedes price movement.
To identify divergences effectively:
1. Select a Time Frame: Start by determining the time frame you wish to analyze. Divergences can appear on various time frames, from minutes to daily charts. Longer time frames often provide more reliable signals.
2. Plot the Chosen Indicator: Add your selected indicator to the chart where you have the price plotted. Ensure you can visualize both elements simultaneously.
3. Look for Divergences: Compare the price movements with the indicator. You are looking for the conditions described under regular and hidden divergences.
4. Confirm with Other Tools: Use additional analysis tools to confirm your findings. This may include support and resistance levels, trendlines, candlestick patterns, or volume analysis. A divergence signal combined with a supportive pattern enhances reliability.
Trading Strategies Using Divergence
1. Entry and Exit Points: For bullish divergence, consider entering a buy position as the price starts to turn up. Place a stop-loss just below the recent low for risk management. For bearish divergence, place a sell order as the price starts to show signs of weakness and move down, using a stop-loss above the recent high.
2. Combining Divergence with Other Indicators: Use other indicators like moving averages to filter trades. For instance, only consider taking bullish divergences when the price is above a moving average to align with the overall trend.
3. Risk Management: Ensure you have a proper risk management strategy in place. This includes determining your risk-reward ratio before entering and adjusting position sizes accordingly.
4. Time your Exit: Set profit targets based on previous support and resistance levels. You could also use trailing stops to secure profits as the trend proceeds in your favor.
5. Continuous Monitoring: Markets are dynamic, and the context in which divergence occurs is constantly changing. Keep an eye on broader market trends that may influence asset price movements.
Conclusion
Divergence is a critical analysis technique that offers valuable insights into potential market reversals or trend continuations. By mastering how to identify regular and hidden divergence and incorporating them into your trading strategies, you can improve your decision-making process.
Always remember that while divergence can signal potential changes in sentiment, it is not infallible; thus, combining it with other technical analysis tools and implementing robust risk management practices will lead to more successful trading outcomes. As you gain experience, you’ll develop a more nuanced understanding of divergence and how it interacts with various market conditions, enhancing your overall trading prowess.
I downloaded this indicator a few days ago. I wish it came with alerts, as I miss a lot of good setups. I would suggest for people to use it with Belkhayate gravity centre indicator, available through MT4 marketplace. Together the 2 indicator work well and you can get better accuracy.
Repaint?
