Submit your review | |
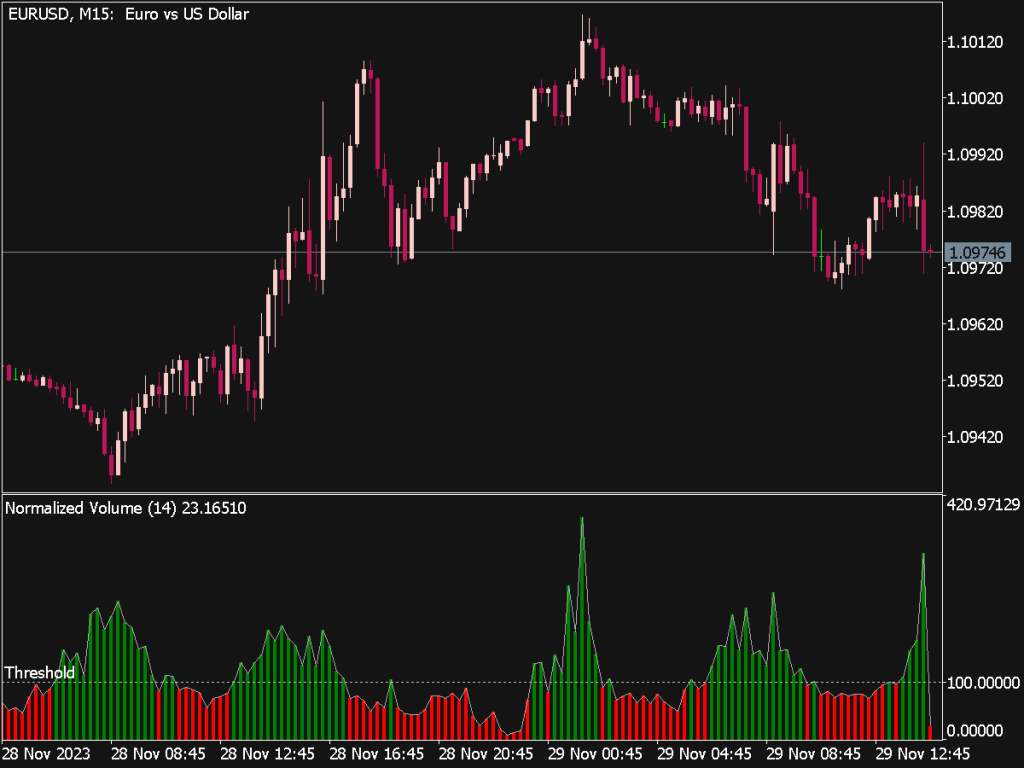
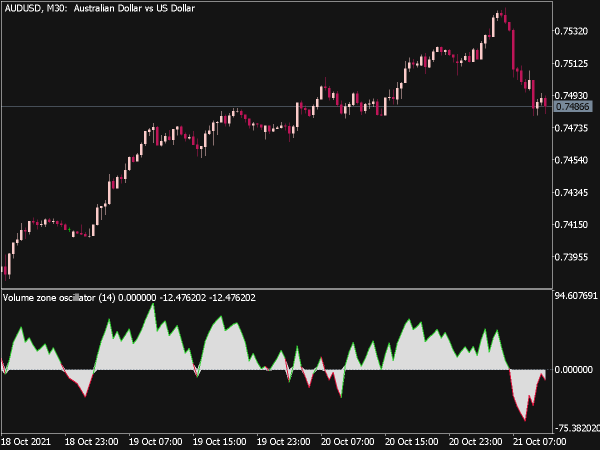
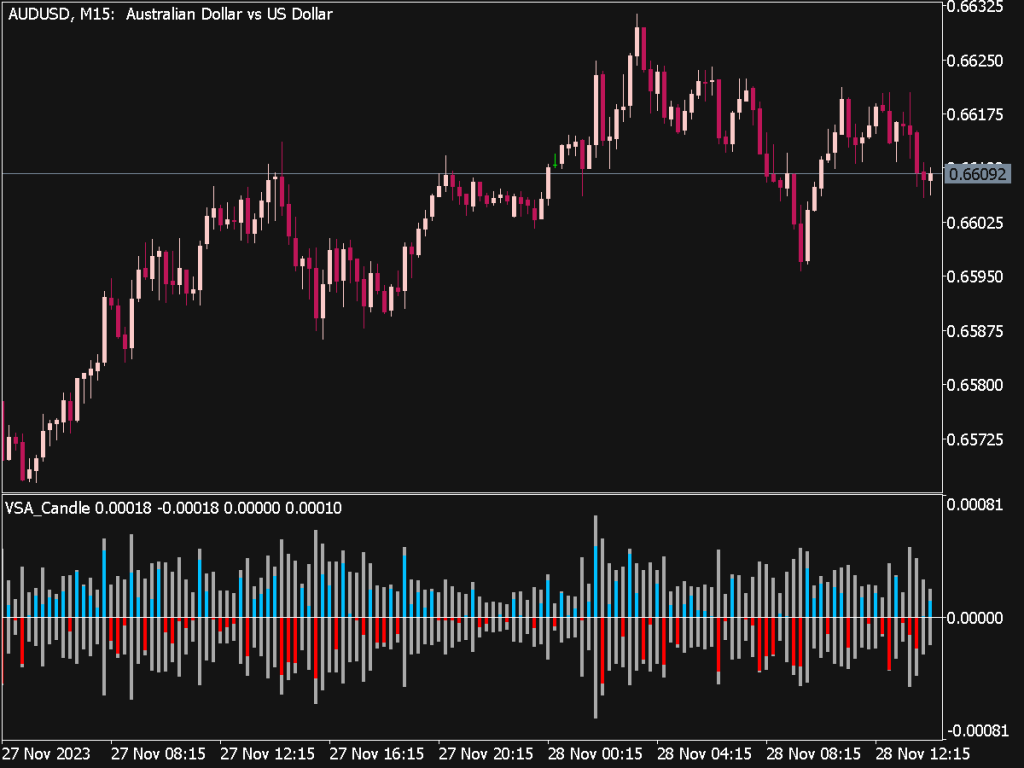
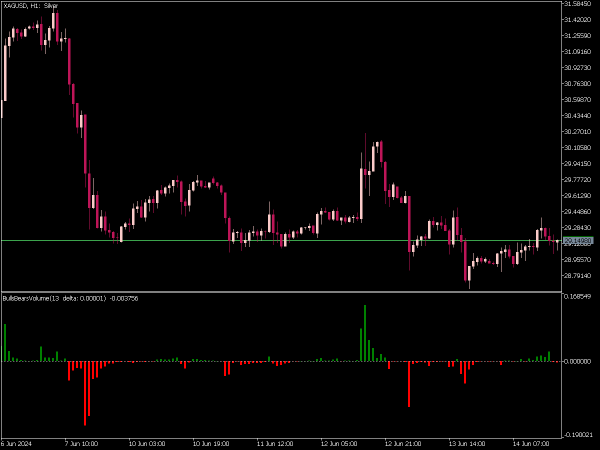
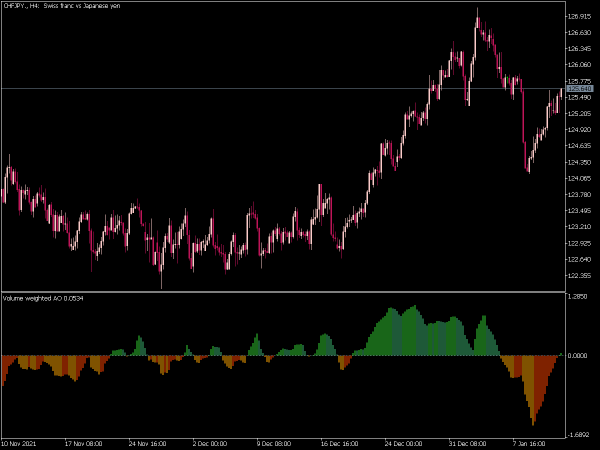
Volume indicators are essential tools in trading strategies, helping traders gauge market strength, identify trends, and determine potential reversals. Here are some tips, rules, and strategies for effectively using volume indicators in trading:
1. Understanding Volume Basics: Volume measures the quantity of shares or contracts traded in a security over a specific timeframe. High volume often indicates strength in a price move, while low volume may suggest uncertainty.
2. Simple Rules to Follow:
• Rule of Confirmation: Always use volume to confirm price movements. A price increase accompanied by high volume is generally more reliable than one with low volume.
• Trend Reversal Signals: Watch for high volume spikes during price reversals, as they may indicate strong interest either supporting or rejecting a new direction.
• Avoid Low Volume: Trading in low volume periods can lead to high volatility and erratic price movements. It is safer to trade during high volume times.
3. Key Volume Indicators:
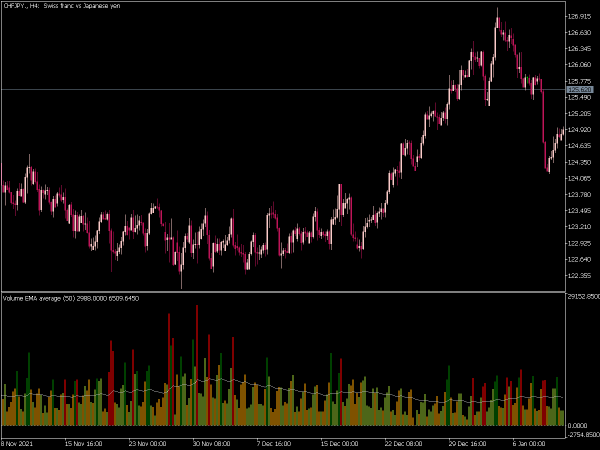
• Volume Moving Average: Compare current volume against a moving average (e.g., 20-day average) to spot unusual trading activity.
• On-Balance Volume (OBV): This cumulative indicator adds volume on up days and subtracts it on down days, helping traders identify trends when price movement may not be clear.
• Accumulation/Distribution Line: This indicator gauges whether a stock is being accumulated or distributed over time by considering both volume and price change.
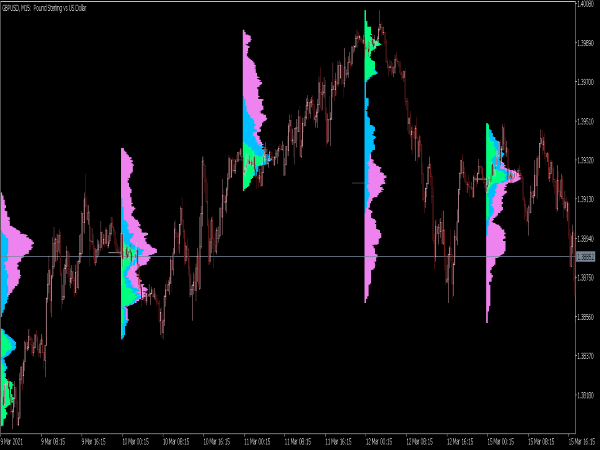
4. Volume Profile: Use volume profile tools to see how much volume occurred at various price levels. This visual representation can help identify support and resistance zones based on past trading activity.
5. Combining Indicators: For a more robust trading strategy, combine volume indicators with price action analysis and other technical indicators. For example, using volume alongside Relative Strength Index (RSI) can provide insights into market momentum.
6. Volume Gaps: Pay attention to volume gaps, where large volume follows a static price. This could signify strong buying or selling interests emerging that could lead to subsequent price movements.
7. Market Sentiment: Use volume indicators to gauge market sentiment; high volume in rising markets may indicate bullish sentiment, while high volume in falling markets may showcase bearish concerns.
8. Use in Different Timeframes: Analyze volume across multiple timeframes (daily, hourly, etc.) to get a comprehensive view of market activity. Significant volume patterns often repeat across different timeframes.
9. Caution with False Signals: Be aware that not all volume spikes signal market direction. A spike with no corresponding price movement can indicate a lack of genuine interest or event-driven volatility.
10. Backtesting Strategies: Before implementing volume-based strategies, backtest them against historical data to evaluate their effectiveness in different market conditions.
In summary, utilizing volume indicators smartly requires a comprehensive understanding of their implications within the context of price action. By adhering to established rules and strategies, traders can enhance their decision-making process, improving their risk management and overall trading success.
